There’s a cohort of people who think the stock market is rigged.
They assume it’s a casino where only certain people win and everyone else loses.
Or everything is manipulated by the Fed and the results are fake.
If it weren’t for the bailouts or falling interest rates or government spending or the Taylor Swift Eras Tour, the whole house of cards would collapse.
There are, of course, checks and balances in our system that have been beneficial to the economy and stock market over the years.1
But it’s ridiculous to assume this means the gains in the stock market are somehow rigged, fake or manipulated.
There is no man behind the curtain pulling levers to ensure stocks go up.
In fact, over the long run, fundamentals still play an important role in the stock market’s success.
Check out this chart2 of earnings vs. the S&P 500 index going back to the end of World War II:
There have been times when prices have gotten ahead of themselves but for the most part stock prices have been going up because earnings have been going up.
Another myth of the stock market is that all of the gains are due to multiple expansion. While it is true that valuations have been slowly rising over time as markets have gotten safer, multiple expansion has probably played a smaller role than most people assume.
The late-John Bogle had a simple formula for expected returns in the stock market that looks like this:
Expected Stock Market Returns = Dividend Yield + Earnings Growth +/- the Change in P/E Ratio
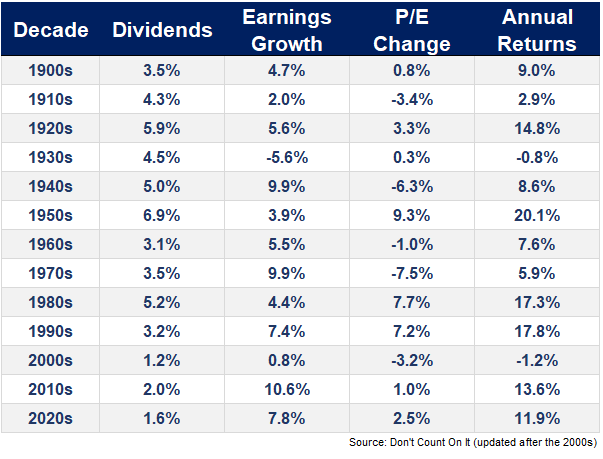
In his book Don’t Count on It, Bogle applied his formula to each decade in the stock market going back to the turn of the 20th century to see how well fundamental expectations matched up with the actual returns.
The difference between the two is essentially human emotions.
Bogle published the data through the 2000s so I’ve been updating his work into the 2010s and 2020s. Here’s the latest data through the end of 2023:

There has been some multiple expansion in the 2010s and 2020s but nothing like the 1980s, 1990s or even the 1930s.
Earnings growth has been the main driver of stock market returns since the end of the Great Financial Crisis.
It’s also worth noting that although dividend yields have been relatively low in recent decades, the growth in dividends paid out by corporations has been healthy.
S&P 500 dividends grew at an annual average growth rate of just 3% in the 2000s.3 That’s well below the historical average of more than 5%.
But since 2010, dividends are up more than 8% per year.4
Dividend and earnings growth have been strong and so has the stock market.
Another reason returns have been so stellar is because U.S. corporations are so much more efficient now.
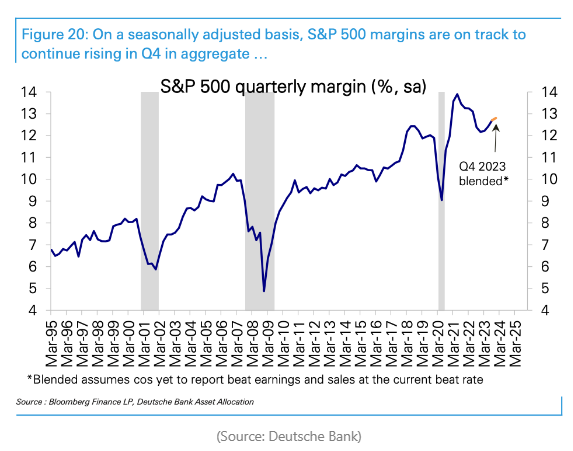
Just look at the upward trend in margins since the advent of the Internet:

There was this idea that profit margins were the most mean-reverting time series in all of finance because of competition and capitalism. Technology stocks have put this idea to rest.
Margins went up and never reverted back to previous averages.
This one chart helps explain the dominance of U.S. stocks over the rest of the world for the past 15 years or so.
The stock market has been good in part because the fundamentals have been good. There are other factors at play, but that’s the simplest explanation.
It is worth noting, however, that stock prices are always going to be far more volatile than the fundamentals, especially in the short run. The stock market is forward-looking but that doesn’t mean it knows how to forecast what’s going to happen next.
Prices move around a lot more than earnings or dividends because of fear and greed.
But in the long run fundamentals tend to win out.
The fundamentals of the U.S. stock market have been exceptional.
Further Reading:
What I Learned From Jack Bogle
1And there always will be these checks and balances. What politician or government official would allow the financial system to implode if they had a way of saving it?!
2Tip of the cap to Sam Ro for this chart.
3The GFC obviously didn’t help here.
4I’m using Robert Shiller’s dividend data here which is only updated through June 2023.