tiero
Financial freedom is what many investors dream of, but good long-term investing is trickier than it sounds.
Investors should become disciplined financial scientists. Focusing on the long-term fundamentals driving 97% of returns, superficially safety and quality first, and prudent valuation and sound risk management always.
I’ve gotten a lot of requests from SA readers about what my portfolio looks like now.
Rather than just show you what my family retirement fund looks like, let me explain the process I used to determine my family’s goals and how to construct a blue-chip, high-yield income growth portfolio for our needs.
Why I Use A ZEUS Portfolio Strategy For My Family Fund
90% of investing success is due to asset allocation, and the asset allocation of the ZEUS strategy is based on the work of Ritholtz Wealth Management’s CIO and Chief Data Scientist Nick Maggiulli, as presented in his wonderful book “Just Keep Buying.”
During the last 50 years, the recession-optimized portfolio, from the perspective of maximizing excess total returns (above treasuries) per unit of downside volatility (the only kind we care about), was:
In other words, rather than worry about what the Fed is going to do this year or next year, what inflation will or won’t be in 2025, or whether the stock market is going to have a correction in the next few months, asset allocation is a true “set it and forget it” sleep well at night strategy.
The Hedging Strategy I Use In My Family Fund
Not everyone needs to use hedges, but given my family’s specific goals, we do, so we use an equal mix of long-duration US treasuries and managed futures.

Wide Moat Research
Combining managed futures with long-duration US Treasuries creates a hedging combo that historically does the mirror image of the stock market during bear markets.
When stocks fall 34%, this combo averages a 33% gain.
If 33% of your portfolio goes up, the mirror image of a market declines, and the rest of it falls as much as the market, cutting your peak declines during market drawdowns by 50%.
- In other words, in a 34% average bear market, your portfolio would be expected to fall 17%
Why does volatility matter?

JPMorgan Asset Management
Fear of volatility is natural, built into human psychology, and the primary reason marketing timing is so appealing to investors. And according to JPMorgan, it’s why the average investor does so terribly.
From 2002 to 2021, the average investor’s inflation-adjusted returns were 30%, while the S&P tripled.
Market timing is great in theory and nowhere else.
Anything that helps you stay the course, following your personal, optimized long-term investing strategy, is actually likely to boost returns if the alternative is panic selling in a bear market.
My ZEUS Family Fund Strategy
| Stock | Yield | Growth | Total Return | Weighting | Weighted Yield | Weighted Growth | Weighted Return |
| ETF Bucket | |||||||
| (SCHD) (high-yield) | 3.5% | 8.5% | 12.0% | 11.11% | 0.4% | 0.9% | 1.3% |
| (SPGP) (deep value) | 1.4% | 13.6% | 15.0% | 3.70% | 0.1% | 0.5% | 0.6% |
| (OMFL) (deep value) | 1.8% | 11.2% | 13.0% | 3.70% | 0.1% | 0.4% | 0.5% |
| (COWZ) (deep value) | 2.1% | 10.8% | 12.9% | 3.70% | 0.1% | 0.4% | 0.5% |
| (SCHG) (growth) | 0.4% | 15.1% | 15.5% | 11.11% | 0.0% | 1.7% | 1.7% |
| Hedging Bucket | |||||||
| (ZROZ) (Long Bonds) | 3.9% | 0.0% | 3.9% | 16.67% | 0.7% | 0.0% | 0.7% |
| (KMLM) (Managed Futures) | 8.1% (long-term index historical average) | 0.0% | 8.5% | 16.67% | 1.4% | 0.0% | 1.4% |
| Stock Bucket | |||||||
| (BTI) (High-Yield) | 9.9% | 8.6% | 18.5% | 5.00% | 0.5% | 0.4% | 0.9% |
| (ENB) (High-Yield) | 7.9% | 3.3% | 11.2% | 4.00% | 0.3% | 0.1% | 0.4% |
| (AMZN) (Growth) | 0.0% | 19.5% | 19.5% | 5.00% | 0.0% | 1.0% | 1.0% |
| (MSFT) (Growth) | 0.7% | 14.1% | 14.8% | 2.75% | 0.0% | 0.4% | 0.4% |
| (BAM) (High-Yield) | 3.7% | 17.7% | 21.4% | 6.00% | 0.2% | 1.1% | 1.3% |
| (NVDA) (Growth) | 0.0% | 27.6% | 27.6% | 3.33% | 0.0% | 0.9% | 0.9% |
| (GOOGL) (Growth) | 0.0% | 12.9% | 12.9% | 2.75% | 0.0% | 0.4% | 0.4% |
| (CRWD) (Growth) | 0% | 34.60% | 34.6% | 2.50% | 0.0% | 0.9% | 0.9% |
| (META) (Growth) | 0.4% | 18.80% | 19.2% | 2.00% | 0.0% | 0.4% | 0.4% |
| Total | 100.00% | 3.7% | 9.4% | 13.1% |
(Source: FactSet Research Terminal)
- MSFT is currently overvalued and a “hold” – not an active buy recommendation.
The goal with my ZEUS Family fund is balance in all things, carefully maintained through a daily spreadsheet that takes me about 15 minutes per day to operate.
- 33% ETFs (33% yield, 33% deep value/GARP, 33% growth)
- 33% hedges
- 33% of individual high-conviction blue chips
- 50% high-yield
- 50% growth
- The best silver/gold-rated ETFs for each purpose
- The best hedging ETFs for each purpose
For example, for bonds, we use the longest-duration bond ETF, ZROZ, specifically designed to deliver a duration of 27.2.
- Duration = what % a bond’s value will change (in either direction) with a 1% change in the yield
So if the average of the 20 and 30-year US treasury yield drops by 1%, ZROZ is expected to increase by 27.2% in value, and if the yield goes up, it crashes by 27.2%.
The rate sensitivity has been brutal recently, but that is just ZROZ doing its job.
- My family’s cost-basis yield is 4.2% on the 30-year yield
- a 2% real-yield (50-year average)

Ycharts
During the Great Recession, long bonds hit a peak gain of 75% and were up 55% in 2008.
| Crisis Period | US Stocks | Bonds | Long Bonds | Cash | Soc Gen Trend Index | RSBT | DBMF | KMLM |
| December 2021 to September 2022 | -25% | -14.4% | -44.8% | 0.6% | 35.6% | 28.7% | 31.6% | 44.8% |
| January 2020 to March 2020 | -20% | -2.6% | 20.3% | 0.3% | 1.4% | 0.3% | -0.8% | 13.9% |
| October 2007 to February 2009 | -50% | 6.1% | 24.0% | 2.5% | 21.6% | 25.9% | 13.5% | 37.4% |
| August 2000 to December 2002 | -41% | 33.4% | 149.6% | 11.2% | 56.3% | 78.6% | 28.8% | 30.4% |
| Average | -34% | 5.6% | 37.3% | 3.6% | 28.7% | 33.4% | 18.3% | 31.6% |
(Sources: Charlie Bilello, Ycharts, Portfolio Visualizer, KraneShares)
You can see why I like KMLM and long bonds for my family’s hedging needs.
While RSBT’s historical backtests are slightly better, KMLM has the most consistent “crisis alpha” during a market selloff.
Whether it a black swan event like the Pandemic crash (fastest bear market in history), the worst inflation in 42 years, or just a bubble popping (tech bubble), KMLM’s index (Mount Lucas) has been delivering the best-managed futures returns since 1989.

KraneShares
The managed futures industry has delivered 4.5% annual returns since 2000, about 0.5% better than bonds, but the Mount Lucas index has delivered 2X the historical returns of its peers since 1988.

KraneShares
Portfolio Fundamentals Analysis
Over the long term (30+ years), 97% of stock returns are a function of fundamentals, not luck.

Daily Shot
What about valuation?

Bank of America
Over a decade, about 80% of total returns are explained by valuations: Earnings, sales, cash flow, and dividends.
So let’s take a look at my ZEUS Family Fund’s fundamentals, which we’ve already seen the summary of:
- 3.7% yield vs 3.5% SCHD
- 9.4% growth consensus
- 13.1% long-term consensus total return potential
This is an excellent way to track the overall portfolio, but what about individual stocks?
My ZEUS Family Fund’s Top Holdings
| ETF | Holdings | COWZ | OMFL | SPGP | SCHD | SCHG | Total Overlap |
New Companies |
| COWZ | 100 | NA | 19 | 0 | 16 | 18 | 53 | 47 |
| OMFL | 358 | 63 | NA | 16 | 35 | 33 | 147 | 211 |
| SPGP | 74 | 27 | 16 | NA | 10 | 32 | 85 | -11 |
| SCHD | 104 | 16 | 1 | 0 | NA | 4 | 21 | 83 |
| SCHG | 251 | 18 | 16 | 0 | 4 | NA | 38 | 213 |
| Total | 887 | 124 | 52 | 16 | 65 | 87 | 344 | 543 |
(Source: ETF Research Center)
The five ETFs I own in the fund total 543 companies and there are two additional non-overlapping ones (BTI, ENB, and BAM) from the nine individual companies I own.
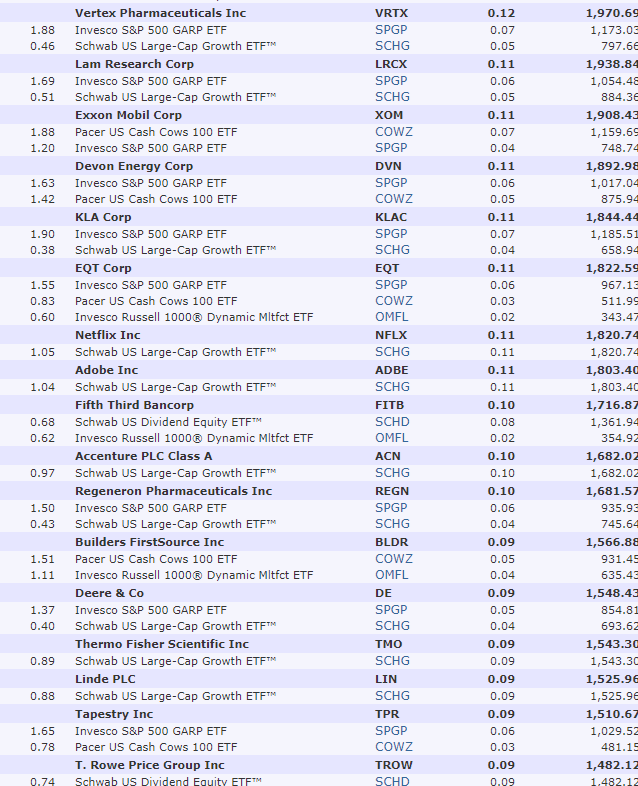
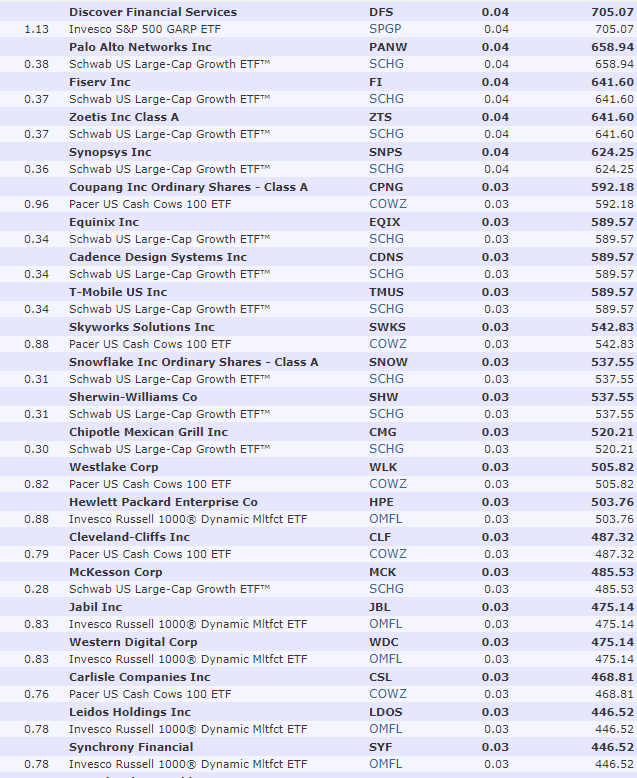
The 546 Companies I Own In Total

Morningstar Premium

Morningstar Premium

Morningstar Premium

Morningstar Premium

Morningstar Premium
Morningstar Premium

Morningstar Premium

Morningstar Premium

Morningstar Premium
Morningstar Premium

Morningstar Premium
Note that I own about 90% of the companies I’ve recommended over the years at Seeking Alpha, just through ETFs, with nine specific companies.
I eat my own cooking, as they say. I just don’t have the time or interest to own over 500 companies directly and spend hundreds of hours per year rebalancing them.

Morningstar Premium
The portfolio is a 70% stock and 30% hedging portfolio.
- I allow up to 10% drift from target allocation for “overweight” and “underweight” based on my conviction/judgment about the state of the economy and likely earnings trends
- So 5% allocation is “overweight” up to 5.5% and underweight would be 4.5%
Risk management is critical, so my risk management rules don’t allow going outside of 10% rebalancing bands.
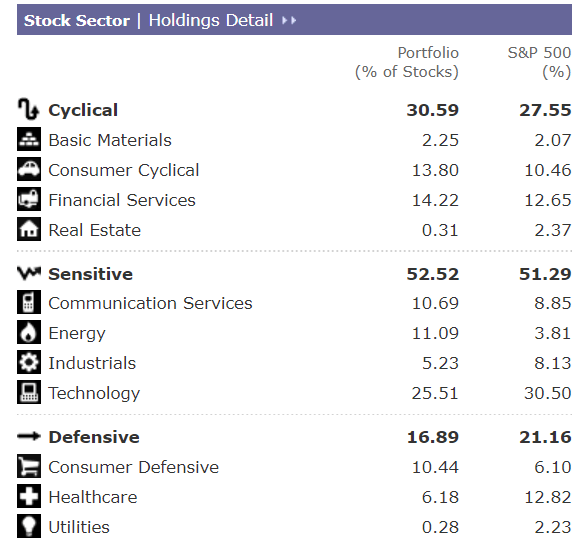
The stock portfolio is 54% growth and 46% value/yield blue-chips.
73% are large caps, 23% are mid-caps, and 3% are small caps.
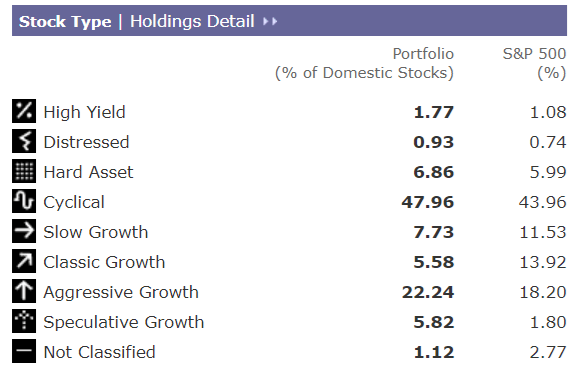
Morningstar Premium
Morningstar Premium
Consumer cyclical and communications are primarily AMZN and GOOGL, so my family fund is about 50% tech.
Morningstar Premium
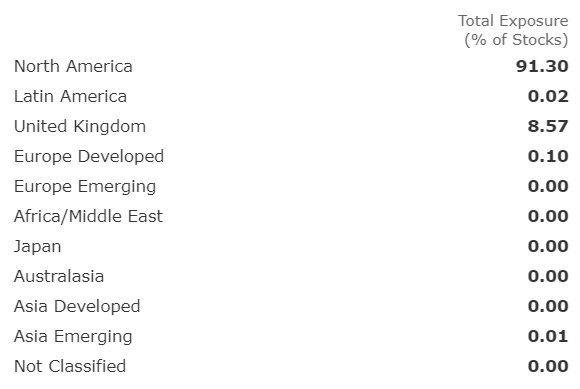
While my family fund is 16% foreign stocks, that’s almost all Canada and the UK, countries with highly dependable dividend payers and strong property rights.

Morningstar Premium
My family fund started out 14% undervalued in December and is still 10% undervalued, trading at a forward PE of 17.5 (historically 19.4, similar to S&P’s 19.2).
Morningstar’s analysts estimate that my stocks will grow earnings at almost 15% annually for the next five years (doubling earnings), and the portfolio ex-hedges yield 2.3%, similar to the dividend aristocrats.
- FactSet consensus for aristocrat growth rate: 4.5% CAGR
- So same yield as aristocrats but a 3X faster growth rate
- And superior valuation (aristocrats are approximately fair value right now)
Morningstar Premium
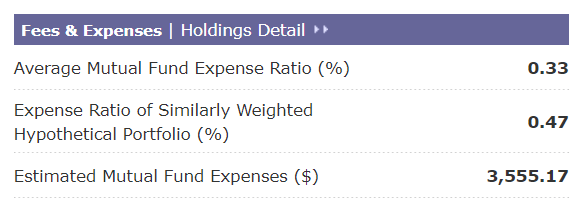
The average hedge fund averages 5% in expenses over time (the 2% and 20% model).
I’m paying 0.33% expenses or about $300 per month to have 67% of the portfolio run by professionals, rebalancing automatically every quarter or six months, and 20% of it is dynamically adapting to the economy.
- OMFL and KMLM are dynamic and adapt to the economy
I consider this a wonderful value, allowing me to manage this fund for 15 minutes per day.
OK, so a nearly 4% yield and 13% long-term consensus total return forecast is pretty impressive, but now let’s put those analyst forecasts to the test.
Morningstar’s 12-month fundamentally justified total return potential
- 2.3% yield + 10.3% weighted earnings growth + 11% return to fair value = 23.6%
In other words, according to Morningstar’s analysts, if and only if these companies grow as expected and return to fair value within 12 months, this portfolio could potentially go up 24% and be completely justified by fundamentals.
- For the S&P to rise 24% in the next year would require a PE of 23, a 19% historical premium
Historical Returns Since December 2007 (Stress Testing The Great Recession)
- In order to backtest this far back, I had to replace KMLM with RYMTX (oldest managed futures mutual fund) and make several other substitutions
- Such as replacing BAM with BN, Meta with GOOG, CRWD with NVDA, QQQ in place of SCHG, VYM in place of SCHD, and VTV in place of SPGP, COWZ, and OMFL
- Preparing For Recession Part 38: How To Back Test And Stress Test Your Optimal Portfolio
See this article for a detailed explanation and proof of the high accuracy of this method of testing asset allocations and past portfolio returns.
I manually calculated the peak decline of the Great Recession by stripping out the hedges, which showed the stock portfolio declined 48% at the March 2009 lows.
I then manually adjusted the hedge bucket returns based on Mount Lucas and Long Bond returns (+44% for the hedging bucket) to calculate the actual peak decline.
- -20% during the Great Recession crash
Less than half the 60-40 retirement portfolio decline.
What about other declines? We’ve had plenty of bear markets since 2007.
My ZEUS Family Fund’s Peak Declines During Bear Markets
| Bear Market | ZEUS Family Fund Peak Decline | 60/40 Peak Decline | S&P Peak Decline | Nasdaq Peak Decline |
| 2022 Stagflation | -17% | -21% | -28% | -35% |
| Pandemic Crash | -7% | -13% | -34% | -13% |
| 2018 Recession Scare | -16% | -9% | -21% | -17% |
| 2011 Debt Ceiling Crisis | -1% | -16% | -22% | -11% |
| Great Recession | -20% | -44% | -58% | -59% |
| Average | -12% | -21% | -33% | -27% |
| Median | -16% | -16% | -28% | -17% |
(Source: Portfolio Visualizer Premium)
The average bear market decline is 62% lower than the S&P and 41% lower than the 60-40 and 55% lower than the Nasdaq.
The median bear market decline is 43% lower than the S&P 500 and the same as the 60-40.
Historical Returns And Income Growth Since 2007

Portfolio Visualizer Premium
While past performance does not guarantee future results, past returns on stable blue-chip portfolios can tell us whether analyst forecasts are reasonable.
Currently, FactSet and Morningstar estimate 13% to 14% long-term returns for this portfolio, and the historical returns over the past 17 years are 13% to 14%.
Note the Sortino ratio (excess total returns/negative volatility) is almost 2X better than the S&P and s hedge fund and almost 3X better than a 60-40.

Portfolio Visualizer Premium
Average rolling returns 2X that of a 60-40 across every period.
And even beating the S&P 500 in a time when very few funds, much less balanced hedge funds that are 33% non-stocks, could even keep up with the market.

Portfolio Visualizer Premium
Very few periods of market envy, i.e., “FOMO” across three-year periods. ZEUS has historically kept up with the S&P, thanks to its 54% growth allocation and 50% tech exposure.
Mind you, the correct benchmark is a 60-40 retirement portfolio, which ZEUS runs circles around very consistently.

Portfolio Visualizer Premium
Income Growth: 12% Annually Since 2008
All hedge funds have lumpy income since you combine stocks with bonds and managed futures, which pay out all their returns as variable income.

Portfolio Visualizer Premium
In 2008, this portfolio would have generated $40,000 in income.
2023 it generated $214,000 in income, twice what a 60-40 would have generated.
- 12% annual income growth for the past 16 years
Advanced Stats: A Very Good Hedge Fund
Let’s look at the long-term advanced statistics for my ZEUS family fund and see how they compare to the 60-40 and the S&P.

Portfolio Visualizer Premium
Standard deviation is a good proxy for the size of the declines you can expect in any given year.
My ZEUS fund’s historical annual declines are about the same as a 60-40 and 25% lower than the S&P’s average 16% peak declines in any given year.
As we’ve seen earlier, the peak decline was actually 20%, but even if we use the -27% recorded (by using much lower quality managed futures), that is far better than the 41% decline of the 60-40.
Alpha is the returns generated by active management. This portfolio’s 6% alpha is very high.
The Sortino ratio is what the ZEUS strategy is optimized for: excess total returns (above treasury bonds) divided by negative volatility.
“For every 1 unit of downside, how much extra gains do I get?”
A Sortino of 1.64 is strong, almost 3X better than a 60-40, and nearly 2X better than the S&P or ‘s hedge fund.
The Treynor ratio is excess total returns divided by beta (volatility).
“For every 1 unit of volatility, how much extra gains do I get?”
High volatility stocks (typically growth stocks), like what ARKK invests in, can sometimes deliver strong gains. Hence, the Treynor ratio is good for checking whether a portfolio drives returns simply by cranking up volatility.
- ZEUS Family fund: 18.6% extra returns per unit of volatility
- Nasdaq: 14.2%
- S&P 9.8%
- 60-40: 7.2%
About 2X the Treynor ratio of the S&P, almost 3X better than a 60-40.
- Those extra 30 basis points of expense ratio have been very much worth it historically.

Portfolio Visualizer Premium
The Calmar ratio is returns/maximum decline, a proxy for “Were the gains worth the maximum pain?”
My ZEUS family fund has a historical Calmar ratio that is almost 2X better than the S&P and 6X better than a 60-40 retirement portfolio.
What’s the conditional value at risk? An advanced statistical concept used by hedge funds and asset managers to manage portfolios.
It uses Monte Carlo simulations to generate probability curves and then uses the 5% worst returns (long tail) to estimate the average single-period peak loss. Here is another way to think about it.
Imagine having a bag of 100 marbles, and each marble represented how much money you could lose in a month from investing. Conditional Value at Risk at 5% (monthly) means that if you take out the five worst marbles (the biggest losses), the average loss of these marbles shows you the typical amount you could expect to lose in a really bad month.
- ZEUS Family fund (terrible future month): -7%
- 60-40: -8.4%
- S&P 500: -10.1%
- Nasdaq: -11.5%
So yes, there will be painful months in the future, but they’re significantly less painful than the S&P or Nasdaq and slightly better than a 60-40 is expected to suffer.
The upside capture ratio tells you what % of the S&P’s upside a portfolio historically experienced during rallies.
- ZEUS Family Fund: 84% of market upside
- 60-40: 69%
- Nasdaq: 125%
The downside capture ratio is the % of the S&P’s decline in a drawdown experienced by a portfolio.
- ZEUS Family Fund: 62% of the market’s downside
- 60-40: 80%
- Nasdaq: 105%
So get 84% of the market’s gains in exchange for 38% smaller declines in down markets.
Compared to a 60-40, it gets you 69% of the gains with 20% smaller declines.
The safe perpetual withdrawal rate was 9%, 3X better than a 60-40s 3%.
- 3X higher retirement income than a standard retirement portfolio
75-Year Monte Carlo Simulation: Statistically Stress Testing The Future (10,000 Simulations)
- The longer your time horizon the more extreme potential outcomes become
- 75-year Monte Carlo simulations are NOT just for very young people
- They’re for anyone who wants realistic probabilistic portfolio outcome analysis
Using 17 years of historical data, including the 2nd largest market crash in US history, an unprecedented Pandemic crash, and the worst inflation in 42 years, we can understand likely investing and worst-case scenarios.
My family donates 5% of fund equity to charity each year, and I give my family annual gifts equal to 10% of donations, 50% in cash, and 50% in stock (ownership stake in the fund).
- So 5.25% annual withdrawal rate

Portfolio Visualizer Premium

Portfolio Visualizer Premium
This is what reality looks like on Wall Street. Histograms and probability curves. It was always this way and always will be.
When you see a base-case estimate, it simply means the most likely (most common) result in simulations like this.
- Some Wall Street banks use 30,000 simulation models

Portfolio Visualizer Premium
13.3% base-case (50% percentile result) with 10.7% inflation-adjusted returns as the base case.
10% safe perpetual decline rate, similar to the historical returns.
Range of likely outcomes (90% probability) 10.7% to 15.8% annual returns.

Portfolio Visualizer Premium
Inflation-adjusted value in 75 years (it’s a perpetual fund): $10.3 million to $306 million.
The probability of beating our benchmark (60-40), which has a 7% consensus future return, is over 99% for the next 50 years.
- This is how I define success, outperforming the lowest risk 60-40 alternative
What’s the probability of beating the S&P’s consensus 10% future return? 91% over the next 50 years.
And what is the probability of beating Nasdaq’s 12.5% long-term consensus? 63%.

Portfolio Visualizer Premium
And that’s assuming no additional investments, and take a look at the amount of income this portfolio is statistically likely to generate.
Inflation-Adjusted Withdrawal Scenarios
| Years From Now | Annual Withdrawals (Worst Case, 10th percentile) | Annual Withdrawals (Base Case, 50th percentile) |
Annual Withdrawals (Best Case, 90th percentile) |
| 10 | $78,461.00 | $155,258.00 | $275,697.00 |
| 20 | $97,246.00 | $245,655.00 | $569,090.00 |
| 30 | $135,108.00 | $391,961.00 | $1,108,357.00 |
| 40 | $173,851.00 | $628,962.00 | $2,102,938.00 |
| 50 | $247,563.00 | $1,006,367.00 | $3,898,537.00 |
| 60 | $346,264.00 | $1,617,186.00 | $7,099,173.00 |
| 75 | $568,006.00 | $3,279,636.00 | $16,968,255.00 |
(Source: Portfolio Visualizer Premium)
Risks To Consider
This is my ZEUS family fund, designed for our very specific goals. It’s not a recommendation for anyone else.
It’s a template and example of how the ZEUS asset allocation strategy can be good for those seeking the best Sortino ratios (best excess returns per unit of downside volatility).
- IE “recession-optimized set it and forget it allocation.”
I’m using the historical analysis to provide statistical looks into a likely future. As you saw in the Monte Carlo Simulation section, there are thousands of potential outcomes, and all investing is probability curves.
There’s no 100% guarantee of any kind on Wall Street. If someone tells you otherwise, they are either ignorant of how things work, a liar, or Bernie Madoff.
Also, remember the John Templeton/Howard Marks certainty limit of 80%. Today, all the fundamental data says this portfolio is very low risk with exceptional long-term growth prospects.
However, in the future, fundamentals will shift. Most likely not very quickly, but ask GE investors how their AAA-rated dividend aristocrat run by Fortune’s “CEO of the century” worked out if they were overweight with poor risk management.
This is why diversification and risk management are crucial to long-term investing success.
In this business if you’re good, you’re right six times out of ten. You’re never going to be right nine times out of ten.”- Peter Lynch
Even the best investors in history are wrong 20% to 40% of the time. Ask Buffett how IBM (IBM), Kraft (KHC), or the airline investments worked out for him.
But thanks to buying great winners like Apple (AAPL) for the long term, Berkshire is sitting on a $300 billion portfolio, and Buffett is the greatest investor of all time.
ZEUS Is Going To Feel Some Pain In The Future… Just Less Than The Market

Portfolio Visualizer Premium
The probability of this portfolio suffering a bear market over the next 75 years is statistically 12%, and the risk of a 40% crash is 1.2%.
Including 5.25% annual withdrawals, the risk rises to 25% and 6%, respectively.
Remember that you can’t avoid market declines; no portfolio can… except for risk-free cash.
But as long as you have a realistic expectation about what your portfolio is likely to do? That’s how you sleep well at night, no matter what the market or economy is doing.
Bottom Line: My Family Sleeps Well At Night With Our Money Protected By ZEUS
This ZEUS Family Fund is just one version of an infinite number of ZEUS portfolios that can be constructed.
But for my family’s goals? By which, I mean my family, best friends, and organizations I most care about. This Zen Extraordinary Sleep Well at Night portfolio comprises 545 of the world’s best blue chips.
Companies with tens of millions of employees operating in every country on earth sell goods and services to every human on earth.
From every corner of the globe doth our dividends flow, and that’s what we use to make our financial dreams come true, help save lives, and, working with millions of other philanthropic people like you, one day save the entire world.
This is the kind of comprehensive, balanced, and evidence-based approach to sound investing that I’ve spent 10 years studying, and it’s a privilege to teach you.
Do you need to go as deep into these historical, and future scenarios as I did with my family fund? Not really.
I just wanted to showcase why my family is so confident in this fund, because when you invest a few hours into making sure all your investing ducks are in a row, then you have a lot more confidence to stay the course when market volatility strikes.
There will be scary times ahead for the economy, market, and my family.
But not from a financial perspective, because we put in the effort and time to focus on:
- Our financial goals and needs
- The optimal asset allocation most likely to meet those goals and needs
- Blue-chip quality assets (3 asset classes)
- Diversification
- Focus on fundamentals (yield, growth, value)
When you focus on these fundamentals, long-term success in achieving your financial dreams becomes a matter of time, not luck.