
Fundamental Scenario of the Yen
The Japanese yen was the worst-performing currency this week, falling by 0.6% and trading near a three-month low.
Recent preliminary GDP data for the fourth quarter of Japan show a warning of a fall into a technical recession, something that will be confirmed after next month’s final release, preventing the Bank of Japan from starting the expected cycle of monetary tightening, or interest rate hikes this year. This scenario has prompted yen sales against its counterparts.
However, the Japanese currency’s major losses were limited by anticipation of possible government intervention in the foreign exchange markets, as weakness above the $150 level has prompted government intervention in the past.
Next, we will present the technical analysis and suggested levels for various yen crosses.
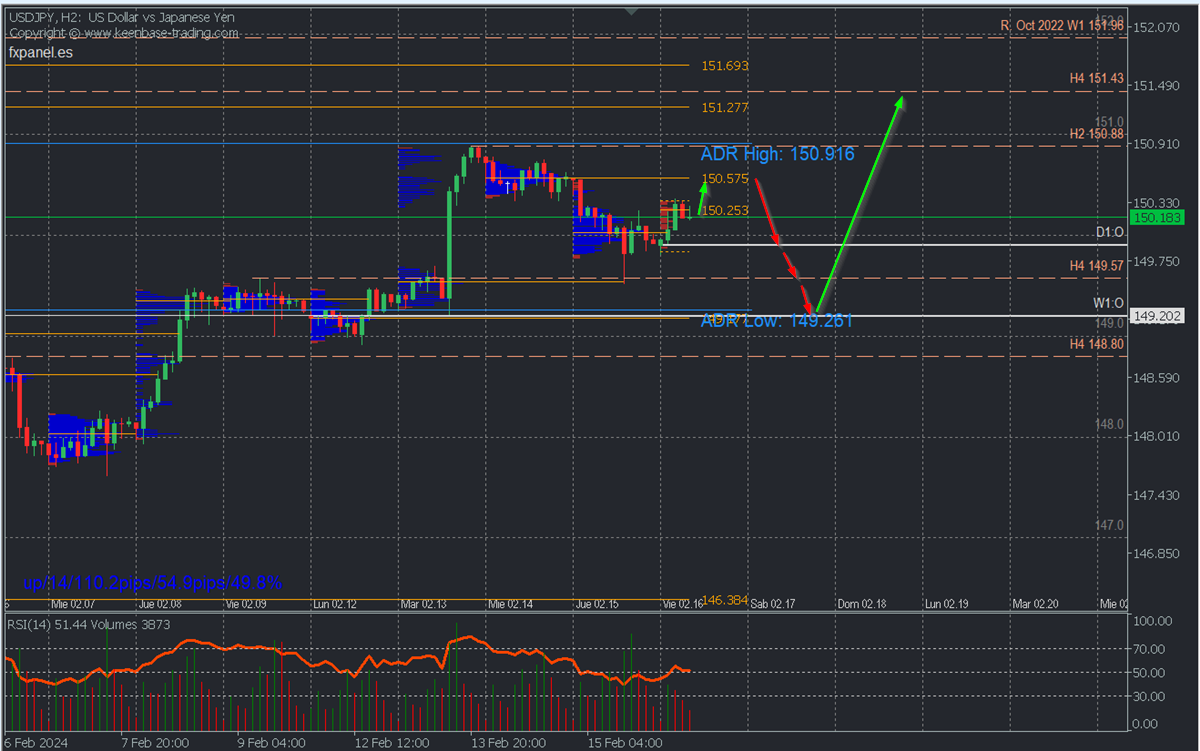
USDJPY
Sell Zone: 150.575 // Buy Zone: 149.26
Situation and general trend:
The pair maintains a bullish macro and intraday trend with the last resistance at 150.88 and the last relevant support coinciding with the weekly open at 149.20. This implies that as long as this support is not broken, further upside movement is expected with the breakout of the indicated resistance.
Bearish Scenario:
After the bullish opening of the day, the price is expected to extend the ascent towards Wednesday’s uncovered POC* at 150.575, with an expected bearish reaction towards 150.00, the support at 149.57, and the next buying zone around the weekly open at 149.20, from where buying is expected to resume, considering that the bulls will defend their previous positions.
The RSI in negative territory and the descending vertical volume on price rises reflect a more bearish intraday momentum.
Bullish Scenario:
The decisive breakout (with candle bodies) of Wednesday’s POC at 150.57 will extend intraday purchases towards the bullish average range at 150.91, implying further upside potential for the next week with attention to the following resistances and uncovered POCs between 151.27 and 151.69.
*Uncovered POC: POC = Point of Control: It is the level or zone where the highest volume concentration occurred. If a bearish movement occurs from it, it is considered a selling zone. If a bullish impulse occurs, it is considered a buying zone.
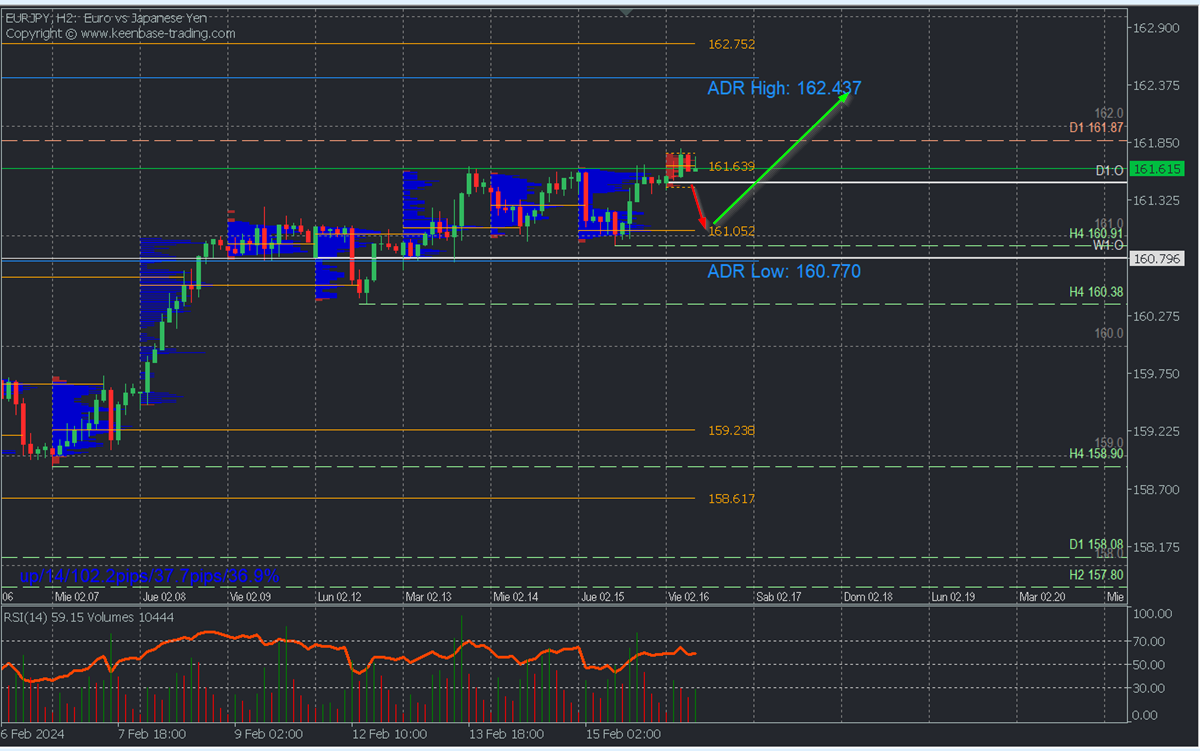
EURJPY
Sell Zone: 162.75 and 161.63 // Buy Zone: 161.05
Situation and general trend:
It seems to have regained bullish strength after the December decline. It faces the January resistance at 161.86, a decisive breakout of which will extend purchases towards 163.00, as long as quotes remain above 161.00, very close to yesterday’s uncovered POC at 161.05.
Corrective Bearish Scenario:
Sales below 161.63 with a target in the intraday buying zone of 161.00 with an expected rebound as a reaction.
Bullish Scenario:
Buying above 161.00 (wait for a pullback to this zone) with a target at the resistance breakout of 161.87 and the daily bullish average range at 162.43, with an expected extension towards the selling zone at 162.75.
*Uncovered POC: POC = Point of Control: It is the level or zone where the highest volume concentration occurred. If a bearish movement occurs from it, it is considered a selling zone. If a bullish impulse occurs, it is considered a buying zone.
Sell Zone: 98.13 // Buy Zone: 97.78 and 97.47
Situation and general trend:
Bullish and surpassing the resistances of January and December, so further upside extension is expected to decisively surpass the September 2022 and November 2023 resistances, especially after the intraday correction. A scenario that will remain valid as long as the last relevant support at 97.31 is not decisively broken.
Corrective Bearish Scenario:
Sales below 98.13 with a target at 97.78 and 97.47 on extension, from where consider purchases.
Bullish Scenario:
Buying above 97.47 (wait for a pullback to this zone) with targets at the bullish average range at 98.33 and the surpassing of the September 2022 and November 2023 resistances at 98.56.
*Uncovered POC: POC = Point of Control: It is the level or zone where the highest volume concentration occurred. If a bearish movement occurs from it, it is considered a selling zone. If a bullish impulse occurs, it is considered a buying zone.