
Japanese Yen, USD/JPY, EUR/JPY, GBP/JPY Talking Points:
- Yen-weakness has continued to run through 2024 trade and USD/JPY is fast approaching a re-test of key resistance, running from 150-152.00 in the pair.
- There’s been little shock around the BoJ since Kazuo Ueda took over at the central bank last year and that’s continued with his comment last week: “Even if we end minus rates, the accommodative financial conditions will likely continue.”
- There’s a risk to leaving negative rates, however, and if that’s happening as other central banks are cutting rates, that could give carry traders even more motive to unwind, which could spur even more Yen-strength which would likely have an impact on inflation in the Japanese economy. So that seems like something they want to approach delicately.
- I’ll be discussing these themes in-depth in the weekly webinar. It’s free for all to register: Click here to register.
Carry trade backdrops can be some of the most attractive venues available to traders, in my opinion. Rates diverging between economies can increase the rollover or swap that’s earned or paid on a currency pair, and as that rate divergence grows so does the rollover or swap.
If long the higher-yielder and short the lower-yielding currency, that rollover can be significant, and that can drive bulls into the side of the pair with higher yield that are looking to capture that rollover. And then as more traders build demand into that side of the pair, a bullish trend sparks that motivates even more to join the trend. And before you know it, we have a strong and elongated trend driven by traders that are earning rollover or swap. If it’s a pair like USD/JPY, this could reward bulls; and then on the other side, traders that are short the pair (long the lower-yielder) then they have to pay rollover or swap. That negative carry increases the costs of holding shorts and, similarly, that can motivate the long side of the pair.
This pretty much explains USD/JPY in 2022. To be sure, the bullish theme in the pair began in 2021 as U.S. inflation was pushing higher, driven by traders pricing-in some inevitable change at the FOMC. Rate hikes in the U.S. started in 2022 and that’s when the carry trade became prominent again and as you can see from the chart below, USD/JPY gained more than 10% in 2021; but in 2022 the pair exploded in the first nine months of the year, tacking on a trough-to-peak gain of more than 33%.
Take notice of the red on the below chart, as that remains central to our discussion today.
USD/JPY Weekly Chart
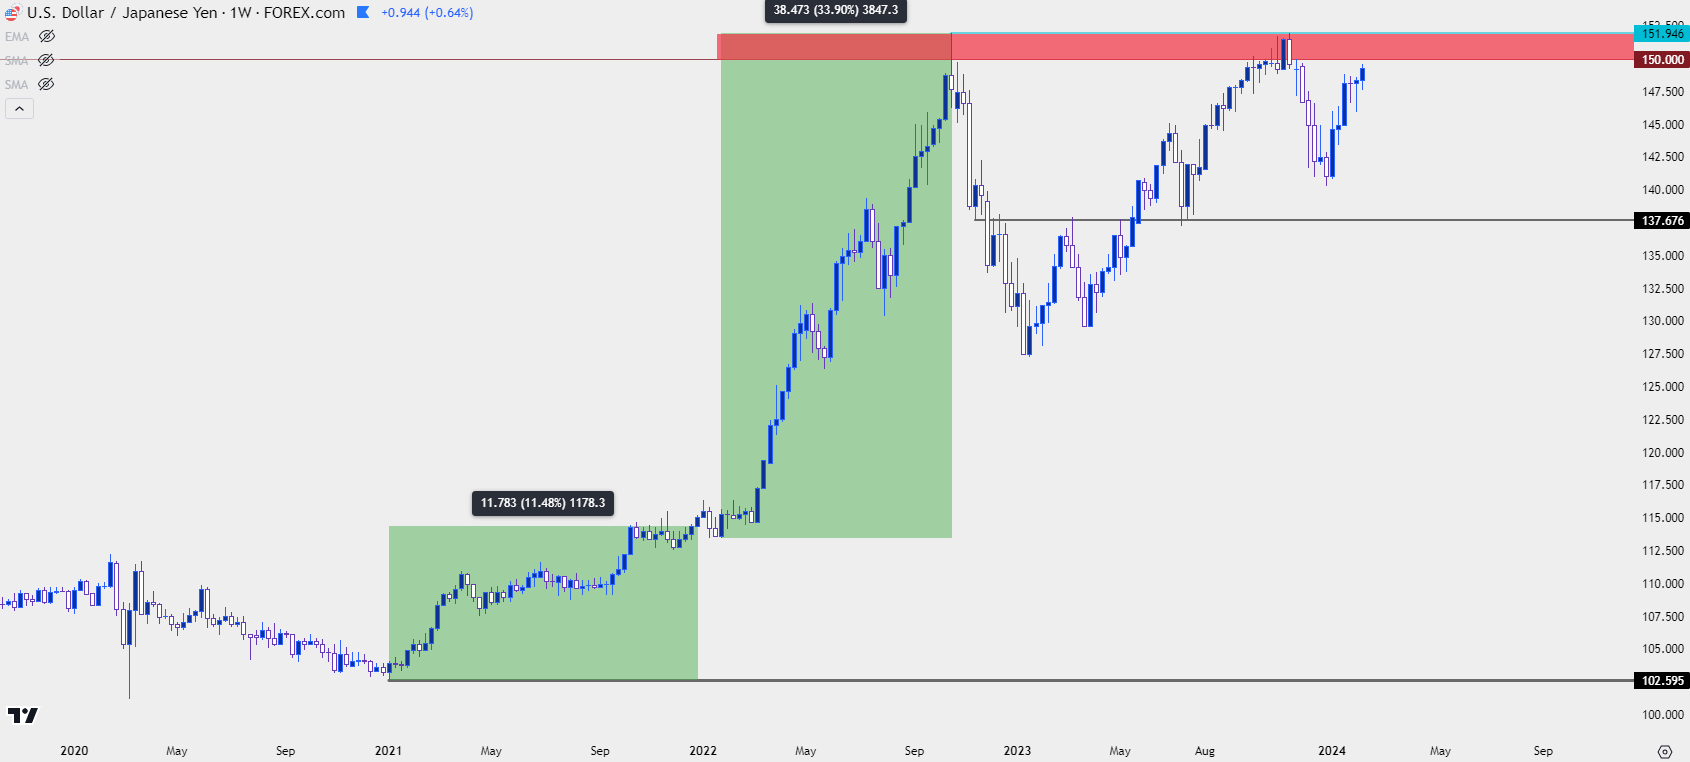 Chart prepared by James Stanley, USD/JPY on Tradingview
Why Did the Trend Turn?
While there’s a plethora of fundamental data points and technical items that can be pointed to, the reality is that price movements in any market are governed by supply and demand. So, when a headline points to a statistic of some sort, such as we’ll see with CPI next week, it’s kind of skipping an important point, and that’s the market reaction. Now, logically these can align in many cases: Slower inflation brings on the thought of softer rate policy which then prices in with more demand for bonds (in anticipation of lower rates).
But when we have a situation like we did in Q4 of 2022, where an elongated trend has run for 21 months to allow a net move of 48% in a non-levered currency pair, it can be reasoned that positioning has become fairly one-sided. And this makes sense, right? Because bears have to pay daily rollover by being long the lower-yielder while bulls had the luxury of daily rollover payments for being long the USD.
Initially the trend slowed at the warning of the Japanese Finance Ministry, and that started to take place at 145, which held the highs in September of that year. When bulls hadn’t yet been re-buffed, the extended that trend up to the 150.00 handle. There was a single daily close above that level and the day after, with bulls trying to run another breakout, the Japanese Finance Ministry ordered the Bank of Japan to intervene in the market by direct buys of JPY.
This had the immediate effect of washing out some bulls as prices quickly broke support; and for the rest of October and the first nine days of November, bulls limply held on to support above the 145.00 handle. It was the CPI report that was released on November 10th of that year that bulls finally had some greater motivation to close their positions, and that led to a precipitous decline. That theme was pushed by a lower-than-expected CPI report that drove a wave of USD-weakness across the FX complex. And as long USD/JPY got frightened of being caught on the wrong side of a USD-trend, a fast sell-off developed.
It took only three months to wipe away 50% of the trend that had taken 21 months to build. And that 50% retracement marker is what helped to set the lows in early-2023 trade; before bulls got back in the saddle for another run at the highs.
USD/JPY Weekly Chart
 Chart prepared by James Stanley, USD/JPY on Tradingview
With the Bank of Japan making no moves last year and with U.S. inflation remaining stubbornly high, the FOMC continued to talk up the prospect of eventual rate cuts without being able to actually cut rates. That kept rollover on the pair high and there remained bullish motive for much of last year until, eventually, USD/JPY had pushed into the same exact 150-152 area that had caused the reversal a year before.
But this time the themes were a bit different: There were accusations of intervention without any evidence to back it but what ultimately helped to tilt a turn was another November CPI report out of the U.S., further pushing the idea that the next move from the Fed would be a cut rather than a hike.
And much like we saw last year, a strong pullback developed and that pretty much ran into the end of 2023 trade. But, this was not nearly as aggressive as what had posted a year prior, as support showed up at the 23.6% Fibonacci retracement of the same major move that held the lows at the 50% marker a year prior. And bulls have been going to work since.
USD/JPY Weekly Chart
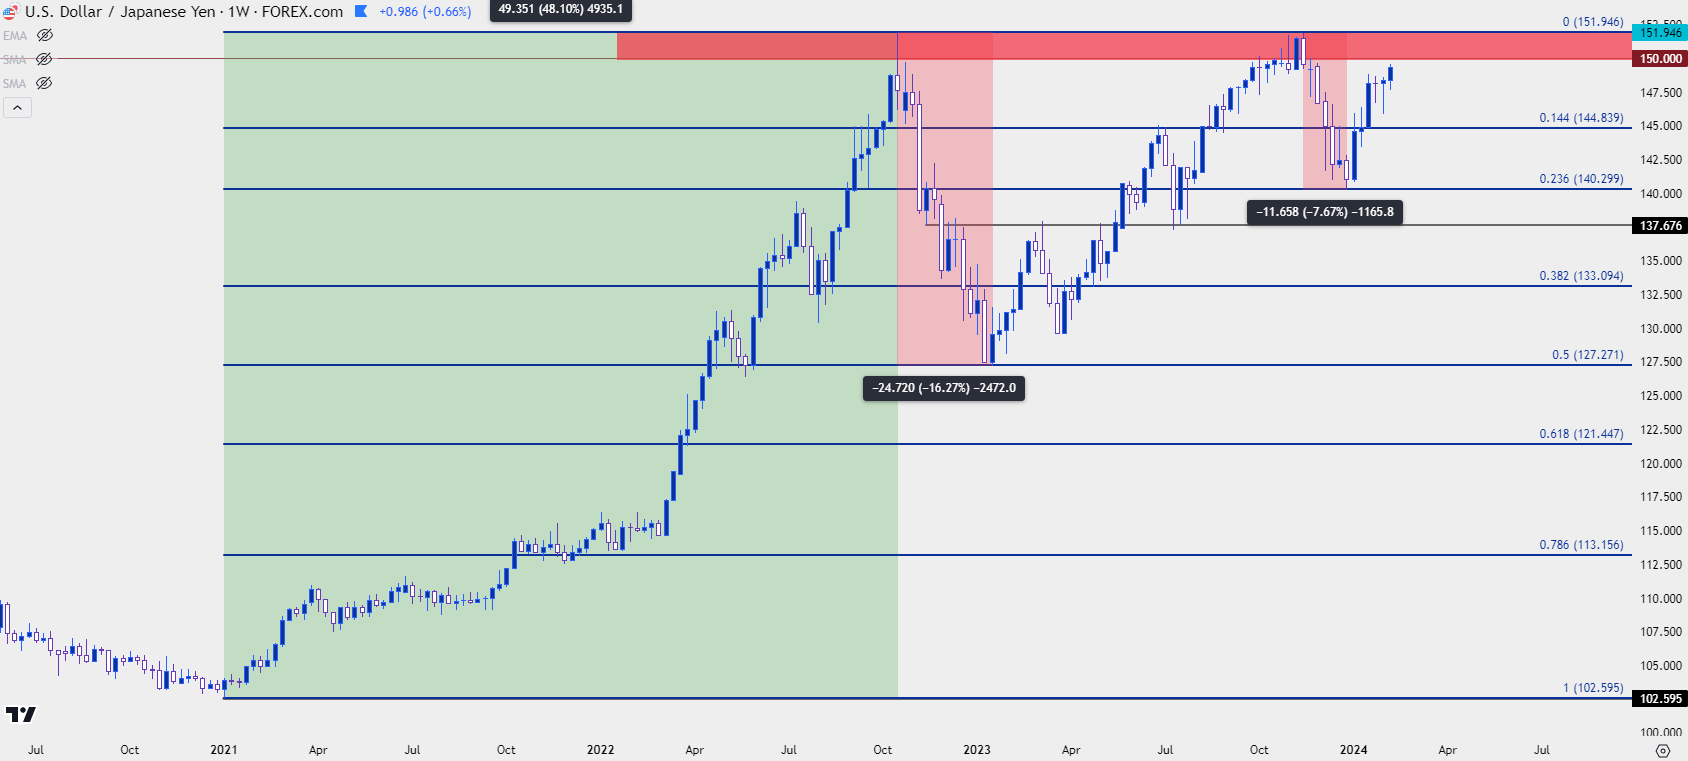 Chart prepared by James Stanley, USD/JPY on Tradingview
Price is now making a fast run at that same resistance zone that’s rebuked the bullish trend twice in the past two years. And naturally, the big question is whether this time is any different.
There’s a couple of decisions points that could provide an answer and the first we’ve already started to hear about while the second will have to wait until the CPI release on Tuesday morning. For the first variable, there’ve already been grumblings from the Japanese Finance Ministry, including comments on Friday. Shunichi Suzuki said that it is ‘important for currencies to move in a stable manner reflecting fundamentals,’ which is a familiar refrain. This is often the type of warning we hear ahead of interventions, but that doesn’t necessarily mean that an intervention will follow. As a case in point, it was those same types of warnings that were coming into play in 2022 when USD/JPY was holding at 145.00, but it wasn’t until the pair had jumped above 150.00 that they were moved to act.
For the second driver, however, it would appear that there would be some vulnerability to the trend on the basis on the CPI print on Tuesday. After all, it was CPI prints in November of the past two years that triggered reversal themes in the pair, and if there is evidence of softer and softer inflation, USD bears could get more ammunition, and that’s something that could compel carry unwind.
That seems to be the big difference between reversals in 2022 and 2023 which, ironically, points back to the Euro. The U.S. Dollar, as DXY, is merely a composite, of which 57.6% is the Euro. In Q4 of 2022 we had the fast pricing-in of European rate hikes as the ECB had warned that they were going to make a stronger stand against inflation. And that was happening as U.S. inflation was softening, leading to a bullish trend in EUR/USD as the USD/JPY reversal was gathering steam.
But in 2023, after the U.S. CPI report in November, the US Dollar fell and continued to do so into the end of the year at which point that trend stopped. And, again, one of the reasons for that is counterparts. There’s little motive to price in higher rates in Europe or the U.K., and that has helped the USD to hold its ground better than it did in the prior instance.
But if USD-bears get a shot-in-the-arm, that could similarly compel carry traders to take profits while they can, fearing a larger pullback or reversal in the event of another wave of Dollar weakness. If the Core CPI print comes out at 3.5% or less on Tuesday, which would be considerably below the expectation of 3.8%, that could give USD-bears some element of drive as there would be more evidence of inflation continuing to slow.
With that said, however, the counter-scenario must also be entertained as there’s a reason for that recent relative strength in the U.S. Dollar and that can be drawn back to continued strength in U.S. economic data. If the CPI report comes out on Tuesday to a larger-than-expected print, USD bulls could get another push of motivation and that could similarly show in USD/JPY as there’s little expectation for near-term change around the BoJ, and that could get price back in the 150-152 area. And there could even be scope for a break and a fresh high.
There would likely stops above the 152.00 handle and if those get triggered that can lead to another wave of demand which could further push a topside breakout. At that point, psychological levels at 152.50 and 155.00 come in as possible reaction points, with the latter likely being a level that could elicit some comments from Japanese government officials, if it comes into play.
USD/JPY Daily Price Chart
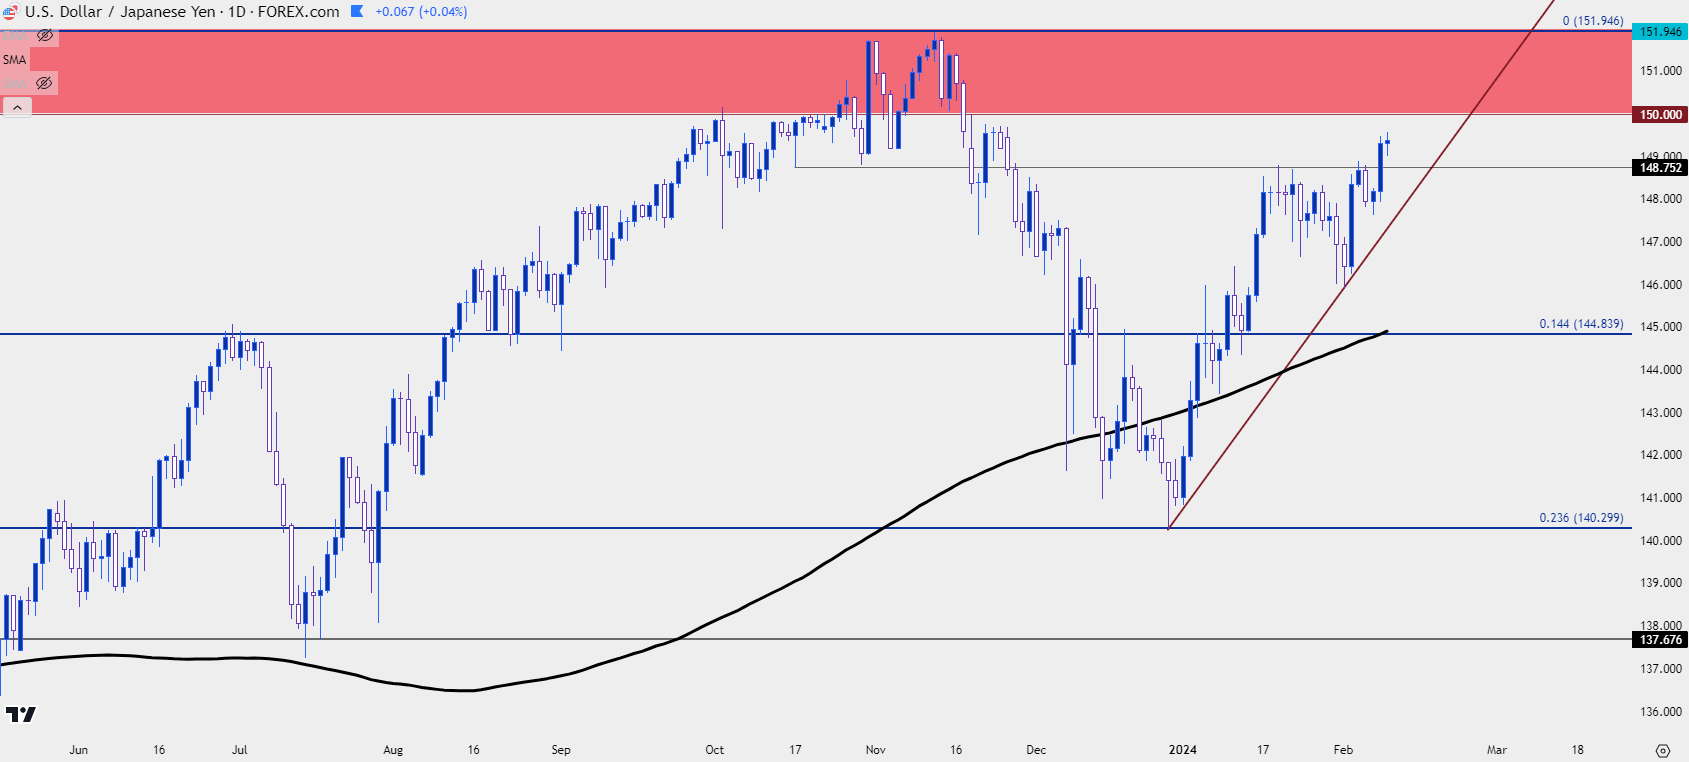 Chart prepared by James Stanley, USD/JPY on Tradingview
EUR/JPY
While rate cuts are expected to begin in the U.S. at some point this year, the same can be said for Europe and similarly, this has kept bulls in the driver seat behind the long side of EUR/JPY for most of 2024 trade, so far. And from a technical vantage point, there may be greater bullish potential given the fact that price isn’t as close to that key resistance as what we had looked at in USD above.
In EUR/JPY, this week was about the 160.00 level, which bulls had held into the close of the prior week despite 200 pips of excursion. This week started with another test below 160 but, similarly, bulls piled in to take-over and this week ended up printing both a higher-high and a higher-low from the prior week. That, coupled with defense of key support at 160.00, keeps the door open for bullish continuation into next week. For resistance, the 161.54 level is already very nearby, but it was the 2023 high at 164.30 that sticks out, after which the 165.00 psychological level comes into the picture.
EUR/JPY Weekly Price Chart
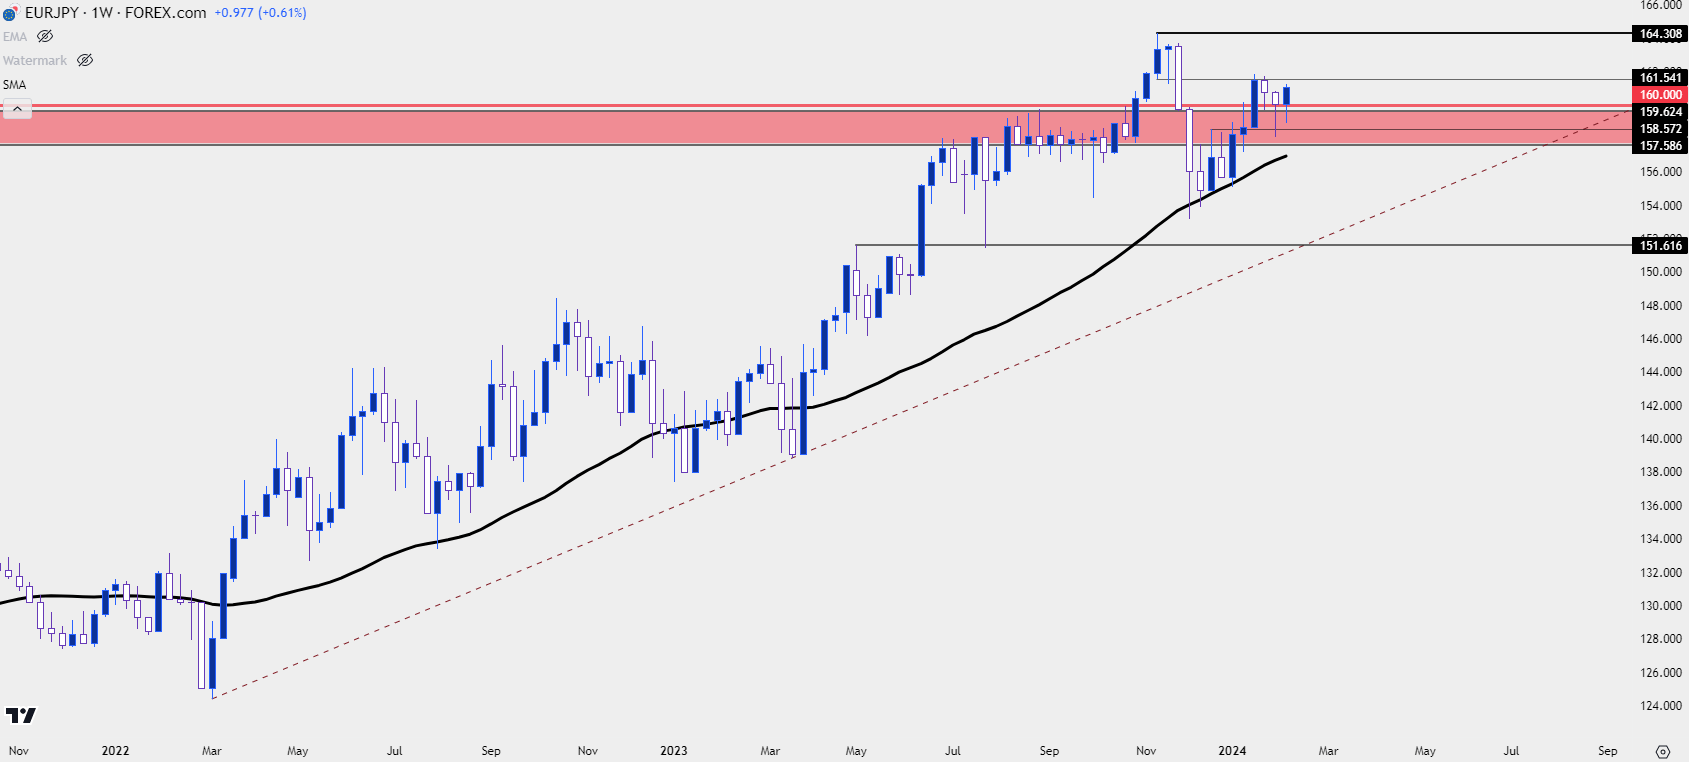 Chart prepared by James Stanley, EUR/JPY on Tradingview
GBP/JPY
GBP/JPY is on the cusp of a fresh eight-year high, as of this writing and from a technical point of view, bulls retain potential beyond that high into a large zone of long-term interest. I’ve highlighted this area on the below monthly chart, which is a gap from August to September of 2008, running from 193.51 up to 198.08.
The bottom portion of that zone is what helped to set the highs in 2015, when Abenomics was in full bloom and ahead of the Brexit referendum that would aggressively reverse that trend a year later.
For current resistance, price is at the projected target from a double bottom formation that set from lows in 2016 to 2020, so there’s some reference for why price has stalled where it has over the past few months.
GBP/JPY Monthly Price Chart
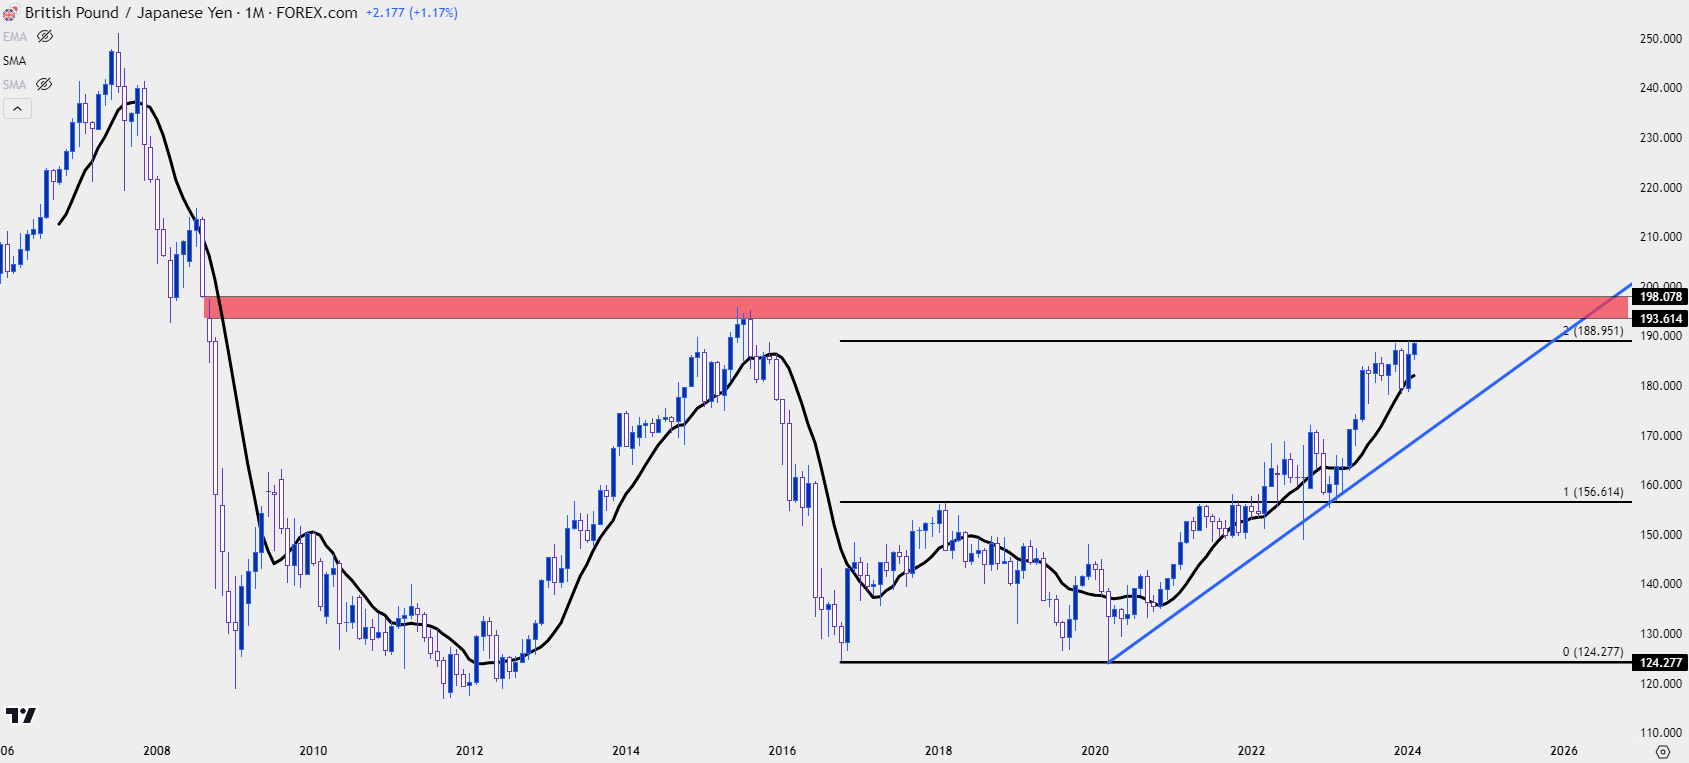 Chart prepared by James Stanley, GBP/JPY on Tradingview

From a purely technical point of view, GBP/JPY would offer the strongest backdrop for bullish continuation amongst the three markets discussed in this article, largely based on the fact that price is already at that high and threatening to breakout while both EUR/JPY and USD/JPY are well-below similar highs.
The complication with GBP/JPY can be dialed back to the fundamental side, as we heard a recent dovish outing from the Bank of England that started to bring to question rate expectations there. There’s also a CPI print being released out of the U.K. next week, a day after the U.S. CPI release, and that’s expected to show at 5.2% for core and 4.2% for headline.
Those inflation reads do not sound like the type of item that would spell rate cuts; but at that last BoE rate decision the bank didn’t seem all too hurried to hike rates again. Nonetheless, just as we saw in USD/JPY in 2021, markets will try to anticipate, and if that CPI print on Wednesday retains strength, that could certainly lead to a strong GBP, particularly if the U.S. CPI release on Tuesday comes out soft. And that could give GBP bulls the motivation that they need to push up to fresh eight-year highs.
The daily chart depicts this backdrop well. There was a 200-day moving average test in early-January and the pair has jumped by more than 1,000 pips from those lows.
GBP/JPY Daily Price Chart
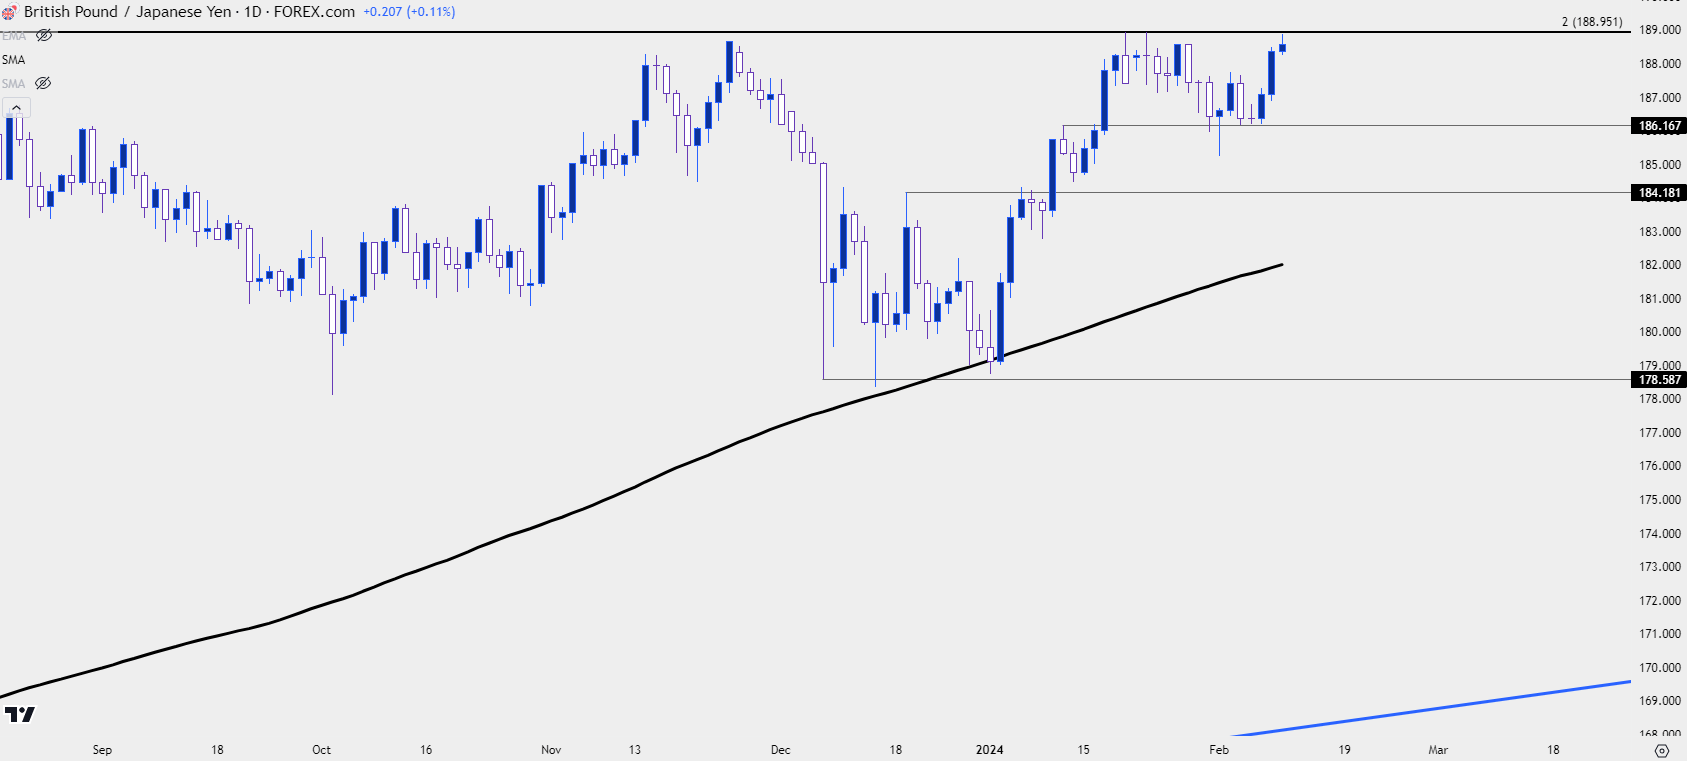 Chart prepared by James Stanley, GBP/JPY on Tradingview
— written by James Stanley, Senior Strategist