JAPANESE YEN OUTLOOK – USD/JPY, EUR/JPY, GBP/JPY
- The yen (JPY) weakens across the board following dovish comments from a key Bank of Japan official.
- Indications that the BoJ will not hike aggressively when it exits negative rates should be bearish for the Japanese currency
- This article discusses the near-term technical outlook for three yen pairs: USD/JPY, EUR/JPY and GBP/JPY
Most Read: Gold Price Forecast – US Inflation Data to Guide Trend; XAU/USD Levels Ahead
The Japanese yen (JPY) weakened across the board on Thursday following cautious remarks by Bank of Japan’s Executive Director Seiichi Shimizu. Addressing the lower house budget committee in parliament, Mr. Shimizu indicated that the BoJ would maintain an accommodative stance for an extended period, even after abandoning negative borrowing costs, which have been in place since 2016.
The dovish statements suggest that the BoJ’s exit from its ultra-loose position will not likely result in multiple rate hikes, as seen in other key economies recently, but rather only a few scattered ones. In theory, this could limit the yen’s recovery potential in the coming months, making it less attractive in terms of its yield differential versus its major peers.
Leaving fundamental analysis aside for now, the remainder of this article will focus on the technical outlook for three important Japanese yen pairs: USD/JPY, EUR/JPY and GBP/JPY. We’ll also assess key price thresholds that should be on every currency trader’s radar, discussing their potential roles as support or resistance levels in the upcoming trading sessions.
Curious about where the Japanese yen is headed? Explore all the insights in our Q1 trading forecast. Request your complimentary copy today!
Recommended by Diego Colman
Get Your Free JPY Forecast
USD/JPY FORECAST – TECHNICAL ANALYSIS
USD/JPY rallied strongly on Thursday, breaking above a key ceiling at 148.90 and reaching its best mark since November last year. If upward momentum continues in the coming days, resistance looms near the psychological 150.00 level. On further strength, all eyes will be on the 152.00 area.
On the flip side, if sellers return unexpectedly and spark a pullback, 148.90 should be the first line of defense against a bearish attack. Further losses beyond this technical floor could draw attention first to 147.40, and then to 146.00 if weakness persists for long.
USD/JPY TECHNICAL CHART
USD/JPY Chart Created Using TradingView
Want to understand how retail positioning may influence EUR/JPY’s near-term direction? Our sentiment guide holds all the answers. Don’t hesitate, get your guide now!
| Change in | Longs | Shorts | OI |
| Daily | 2% | 3% | 3% |
| Weekly | 6% | 11% | 10% |
EUR/JPY FORECAST – TECHNICAL ANALYSIS
EUR/JPY soared on Thursday, breaching short-term trendline resistance at 160.00 and approaching another key barrier stretching from 161.15 to 161.75. Bears must fiercely defend this ceiling; a failure to do so could trigger a rally toward last year’s highs near the 164.00 handle.
In the event of a bearish reversal, support emerges at 159.70. Below this point, the 100-day simple moving average becomes the next potential technical floor for the market, succeeded by the 50-day simple moving average at 158.30. Further down, the focus shifts to 157.50.
EUR/JPY TECHNICAL CHART
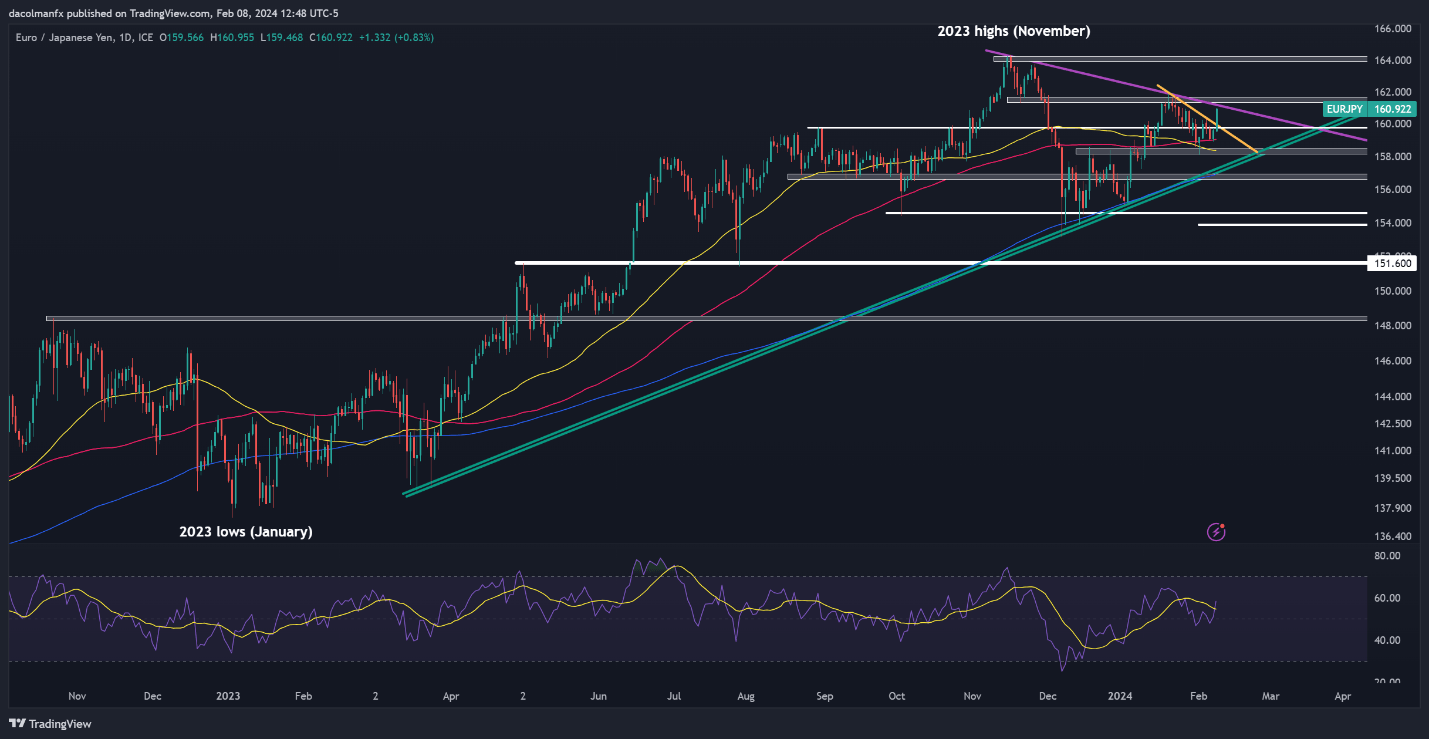
EUR/JPY Chart Created Using TradingView
Feeling discouraged by trading losses? Take control and improve your strategy with our guide, “Traits of Successful Traders.” Access invaluable insights to help you avoid common trading pitfalls and costly errors.
Recommended by Diego Colman
Traits of Successful Traders
GBP/JPY FORECAST – TECHNICAL ANALYSIS
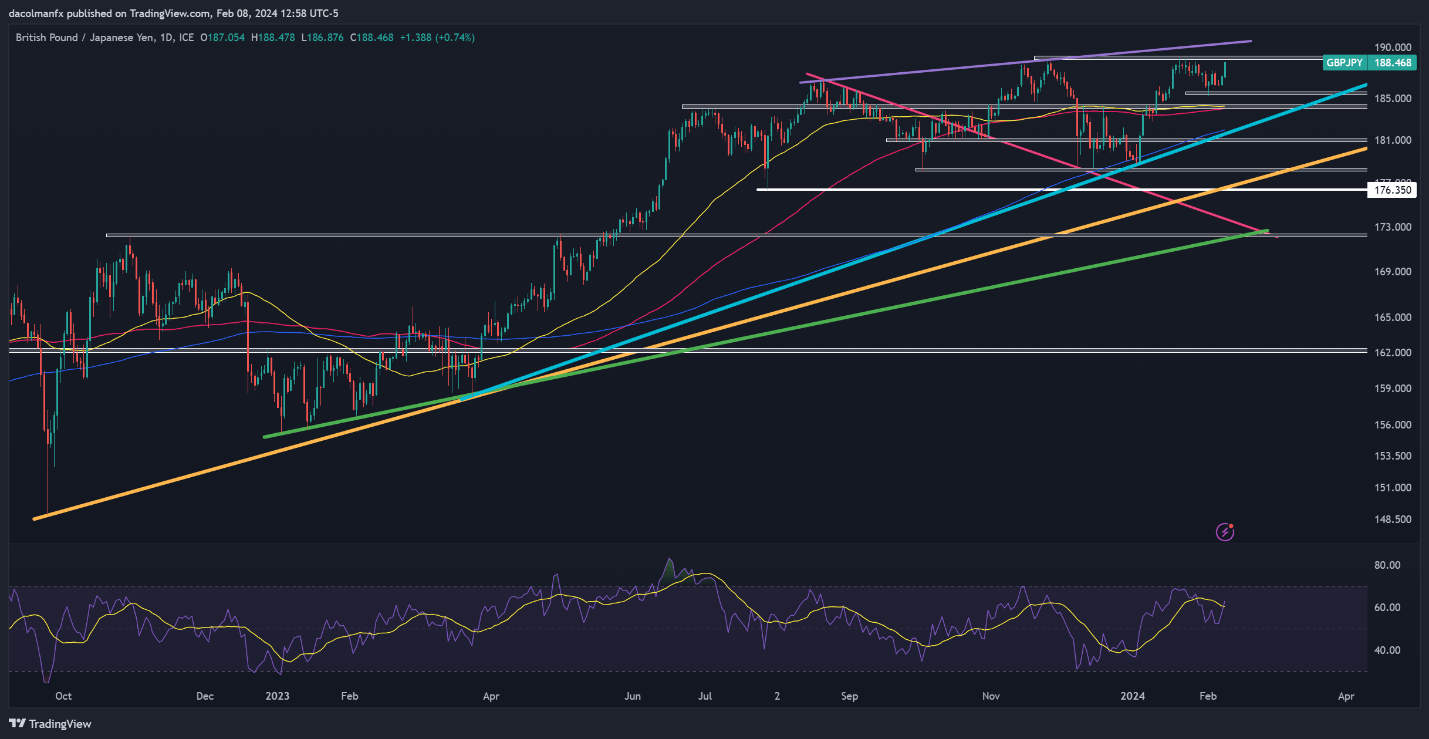
After a moderate pullback in late January, GBP/JPY has mounted a strong comeback in recent days, steadily approaching its multi-year highs set around 189.00. Bulls are likely to encounter stiff resistance around these levels, yet a breakout could propel the pair towards 190.50.
On the other hand, if the bullish impetus fades and prices turn lower, initial support is positioned at 185.50. While GBP/JPY may stabilize upon testing this region ahead of a possible rebound, a breakdown could prompt a retracement towards 184.20, close to the 100-day and 50-day simple moving averages.
GBP/JPY TECHNICAL CHART