
courtneyk
SA readers have expressed interest in my personal family fund portfolio and so have our subscribers.
I will start tracking this portfolio each week
- Real-time email trade alerts
- Weekly trade summary and performance tracking (ZEUS/Zen Portfolio Tracker)
- Quarterly Update article (just like a hedge fund provides its clients every quarter)
In preparation for that, I am fine-tuning my portfolio and wanted to share these updates and my investing insights with you.
This is not because I recommend that you follow me precisely, but so that you can learn about my investing process and hopefully improve your own.
I am not providing personalized investment advice of any kind. This portfolio is an example of prudent and reasonable risk management and asset allocation for my family’s needs.
Fine-Tuning Trade 1: Overweighting Nvidia To 5.5% Of The Portfolio
Let’s start with a rare pre-market buy I made.
Interactive Brokers Interactive Brokers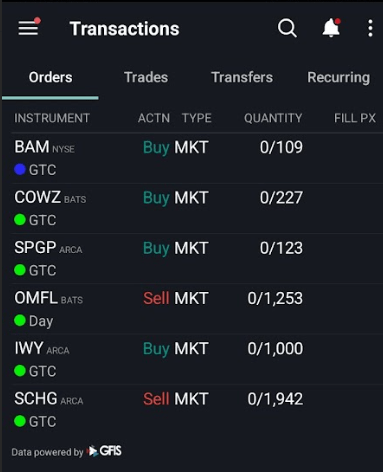
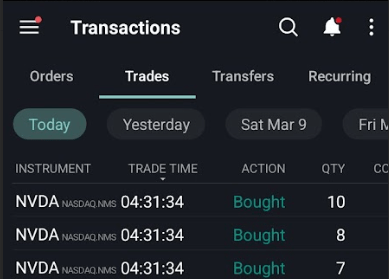
Rather than risk that Nvidia (NVDA), which fell 8% Friday (including after hours), might open up 3% or more, I bought my additional 25 shares pre-market at $896.95.
- morning valuation update (based on daily consensus 2024 and 2025 forecasts from 61 analysts courtesy of the FactSet Research terminal)
- $1007 fair value today
- $1170 fair value by year-end (assuming current consensus estimates don’t change)
- Current fundamentals would justify a 31% upside by year-end. Not a forecast, just what would be 100% sanctified by fundamentals.
I spent much of the weekend watching NVDA CEO Jensen Huang’s presentations at Columbia and Stanford and keynote speeches at various conferences.
Here are my takeaways.
- Huang is a subject-matter expert (a Master’s in Engineering from Stanford is just the beginning)
- Co-founder and CEO since day 1 at NVDA (founded 1993)
- He says he wants to remain CEO for 30 to 40 more years (age 91 to 101)
- The most exciting part of NVDA’s growth thesis isn’t chips but AI enterprise software (recurring subscription revenue)
Analyst firm Mizuho estimates that 2033 the AI chip market may reach $400 billion in 2033, and Advanced Micro Devices (AMD) thinks it could happen as early as 2027.
Currently, NVDA has nearly 95% market share in AI chips, which will come down (Standard Oil had only 90% market share).
Mizuho thinks NVDA can maintain a 75% market share in the long term because of what Jensen Huang has said in conferences.
- NVDA plans to launch six major chip platform upgrades in 3 years and then do annual updates after that
- approximately a 320X increase in AI processing capability between 2023 and 2025
- and then 2X improvement with each year’s annual update cycle
That means NVDA management thinks it can launch 16 new AI chip systems in 13 years and increase its AI processing capacity (for LLM training) by approximately 320,000X.
How on earth do they think they can accomplish that level of increase and keep it up for the long term? And why does Mizuho think their market share will stabilize at 75% when everyone and their mother is racing to develop AI chips?
According to Jensen Huang, NVDA uses its lead in AI hardware and integrated software to design future upgrades.
It has AI algorithms that optimize its chips and software packages, including the Cuda software platform it began developing in 2006, specifically to allow this kind of breakthrough innovation for itself and its clients.
In other words, NVDA has the best chip-focused AI in the world, designing exponentially better AI chips and software platforms.
That’s why it is not just the world leader in tech today but thinks it will maintain or potentially expand that lead over time.
Nvidia is building a new business unit focused on designing bespoke chips for cloud computing firms and others, including advanced artificial intelligence (AI) processors, nine sources familiar with its plans told Reuters.” – Reuters
NVDA is also planning to compete with Broadcom (AVGO) in designing custom chips for customers such as Alphabet (GOOG) (GOOGL), Microsoft (MSFT), Meta (META), and Amazon (AMZN).
- sales to Meta alone were $8 billion in the most recent quarter
These tech giants are working on their own AI chips, but NVDA wants to minimize that risk by offering to design better chips faster and cheaper with an outsourced solution.
Let’s not forget the $1 billion per year run-rate AI enterprise software business that management discussed in the conference call and which Jensen Huang thinks might one day represent the majority of company revenue.
Broadcom has spent years and several major acquisitions transitioning its sales to majority software subscriptions, just as Microsoft, Adobe, and numerous other tech giants have.
- software subscriptions have almost 70% gross margins at Microsoft
NVDA’s gross margin guidance is 77% for the coming quarter, and some analysts think that AI software revenue, if it becomes the majority of company sales, could push that to 80% over time.
- Under the current tax code, 67% net margins are as high as any company can achieve
- Visa (V) has approximately 60% margins at the moment
NVDA has 48% net margins today, and by 2026, analysts think they will rise to 55%.
Suppose Mizuho or AMD is correct; the AI chip market alone reaches $400 billion. In that case, NVDA could generate $300 billion in annual AI chip sales + recurring software sales (the majority of company revenue).
- over $600 billion in potential revenue between 2027 and 2033
- with potentially over $400 billion in net income
- that’s not cyclical but is getting more stable and recurring each year
There is naturally a lot of uncertainty with a company growing as fast as NVDA, which is why it is volatile.
Portfolio Visualizer 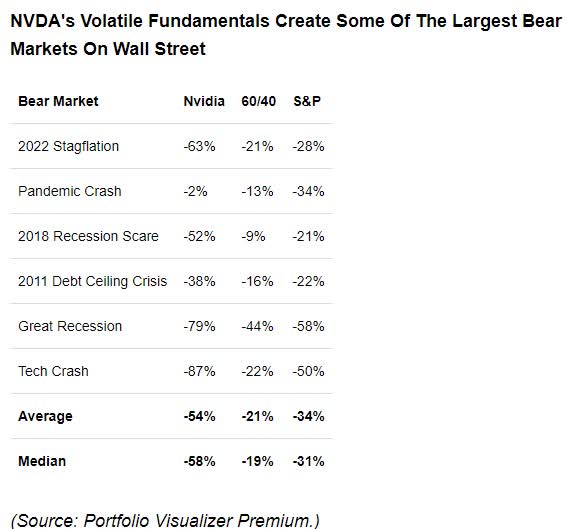
If Mizuho is correct in its 2033 $400 billion AI chip market forecast, NVDA could reach a $16 trillion market cap within nine years, completely justified by historical valuations and explosive growth in net profits.
- assuming 1% annual buybacks and a 27% annualized total return potential (justified by fundamentals) over the next nine years
If AMD is correct? If AI chips hit $400 billion in sales by 2027?
NVDA sales are expected to grow to $188 billion in 2027 and $220 billion by 2029.
FactSet Research Terminal 
Pre-earnings, the 2029 consensus was for $200 billion in sales. Then management beat and raised guidance 10%, and now it’s $220 billion.
One year ago, it was $100 billion in sales…for 2028.
NVDA is expected to generate $104 billion in sales in 2024 alone, with over 50% net margins.
- $54 billion in net profit in 2024
- double 2023’s profit
- up 13X since 2022 (pre-Chat GPT)
If NVDA were to beat and raise 10% each quarter for the rest of the year (three more times), then 2029 consensus sales estimates could rise by 33% to nearly $300 billion.
And remember that NVDA is accelerating its product launch cycle.
- One major AI chip system in 2023
- 2 in 2024
- 3 in 2025
- One major upgrade every year after that (targeting a 100% annual boost to AI training capacity)
The A100 chip (70 lbs and 35,000 parts) cost $10,000.
The H100 costs $20,000.
The H200 is expected to cost more, and the B100 is rumored to cost as much as $70K.
How expensive could NVDA chips get? According to Jensen Huang, Tesla previously paid as much as $250,000 for accelerator hardware packages.
If NVDA can ramp successfully, they may be supply constrained for 2024, 2025, and potentially into 2026 when they ramp up their latest chips.
So, I would not be surprised to see NVDA beat and raise every quarter for several more years.
- Apple’s iPhone allowed it to grow at over 100% annually for several years
- and beat earnings estimates for 28 consecutive quarters (7 years)
There is a lot that could go wrong for NVDA, but Jensen Huang has proven that he has execution excellence, on top of being able to forecast and position NVDA for the future of tech correctly.
- first into gaming
- first into accelerator software integration (2006)
- first into data centers
- first, into crypto-specialized chips
- first into driverless car chips and IOT
If there is anyone, I trust with my hard-earned savings for the next 30 to 40 years, it’s a man who, for 31 years, has proven himself the Warren Buffett of technology.
- NVDA is up almost 2,000X since its IPO in 1999.
Over the next 30 to 40 years, it’s impossible to know just how rich Huang might make investors if his health holds up, and he remains as sharp as he’s been for the last 31 years.
- NVDA is the best-performing stock of the last 30 years
While it’s not likely to go up another 2,000X in the next 30 years, for long-term investors, the potential to profit not just from AI hardware leadership but also from recurring annual revenue software sales makes for a strong long-term case.
- Mastercard and Visa process 25% of the global economy through their networks, taking a 2.5% cut.
- Imagine, in 40 years, NVDA will take a 1% to 5% cut of an even larger share of GDP (software licensing revenue) in a much larger economy.
After the iMac’s success, many investors questioned where Apple (AAPL)’s next growth explosion might come from.
Steve Jobs invented the iPod, which became the biggest part of the business and made Apple a global giant.
Then, he introduced the iPhone, which created a new category, changed the global economy forever, and made Apple the world’s second-most valuable company.
As late as 2016, you could have bought Apple and made impressive gains, just like Warren Buffett.
FAST Graphs, FactSet, Whalewisdom
According to WhaleWisdom (which tracks 13-F filings), Buffett’s cost basis for Apple is approximately $39.
He made over 350% total returns on a company with a market cap of $800 billion.
2013, Apple fell to 8X and 5X cash-adjusted earnings due to iPhone growth fears.
In 11 years, one of the largest companies in the world in 2013, 9X its market cap and
Ycharts
In 2013, everyone in the world heard of Apple. It was almost $400 billion in market cap. In 11 years, it made investors return 14X and 16X before its recent correction began.
- 29% annual total returns for over a decade
- starting out in one of the world’s best and most famous companies
I’m NOT saying NVDA is the next Apple. I’m saying that anyone who thinks Jensen Huang will keep innovating and keeping ahead of the competition for decades to come (up to 40 per his own goals) should consider owning NVDA.
My conviction is so high on NVDA that I’m willing to risk the maximum 5.5% my family fund’s risk management rules permit.
- Only my highest conviction stock of all (BAM) has a higher risk cap (6.6%)
Size your NVDA position appropriately for risk tolerance, factoring in its historically extreme volatility.
- NVDA can fall 35% in a month and has fallen 30+% in a single month five times before
My Other Fine Tune Trades
For the sake of time, I will briefly summarize the remaining trades.
Fine-Tuning Trade 2: Why I’m Topping Up Brookfield To Its 6.6% Overweight Position
FactSet Research Terminal 
Brookfield has relieved 40 years of 20% annual returns, and 20 of those are under CEO Bruce Flatt, now joined by Howard Marks, legendary fixed-income investor (Brookfield bought Oaktree).
Flatt says the company sees a clear path to 20 more years of similar returns and can double assets under management in the next five years due to contracts already signed with existing clients.
- if clients like a pension fund sign on with BAM, they must provide the investable assets when called upon
- or get sued
- and lose in court
BAM yields 3.4% right now, and analysts expect 17.7% long-term earnings growth and 21.1% long-term consensus total return potential.
Management is guiding for 15% to 20% growth and 18.4% to 22.4% long-term returns.
This morning, while updating the valuations and fundamentals on all my holdings for this article, I found out BAM is now slightly undervalued and thus open to top it off to 6.6%, an overweight from my 6% target allocation on my highest conviction company.
- No other company I know of has a legendary CEO who has guided the company for 20 years with approximately 20% annual returns.
- His track record of excellent risk management and proven returns makes me think it is credible guidance.
Fine-Tuning Trade 3: Why I’m Replacing SCHG With IWY For Our Growth ETF Allocation
Nearly 100% of long-term returns are determined by asset allocation.
In other words, weighing the different asset classes and investing strategies you use is pretty much the whole ball game.
| Stock | Yield | Growth | Total Return | Weighting | Weighted Yield | Weighted Growth | Weighted Return |
| SCHD | 3.9% | 8.1% | 12.0% | 11.44% | 0.4% | 0.9% | 1.4% |
| (SPGP) | 1.2% | 15.2% | 16.4% | 5.89% | 0.1% | 0.9% | 1.0% |
| (COWZ) | 1.8% | 12.1% | 13.9% | 5.89% | 0.1% | 0.7% | 0.8% |
| (IWY) | 0.7% | 15.3% | 16.0% | 11.69% | 0.1% | 1.8% | 1.9% |
| ZROZ | 3.7% | 0.0% | 3.7% | 15.00% | 0.6% | 0.0% | 0.6% |
| KMLM | 8.1% | 0.0% | 8.1% | 15.00% | 1.2% | 0.0% | 1.2% |
| BTI | 10.0% | 8.6% | 18.6% | 5.50% | 0.6% | 0.5% | 1.0% |
| ENB | 7.6% | 3.8% | 11.4% | 4.00% | 0.3% | 0.2% | 0.5% |
| AMZN | 0.0% | 30.6% | 30.6% | 5.50% | 0.0% | 1.7% | 1.7% |
| MSFT | 0.7% | 14.1% | 14.8% | 2.00% | 0.0% | 0.3% | 0.3% |
| BAM | 3.6% | 17.7% | 21.3% | 6.60% | 0.2% | 1.2% | 1.4% |
| (NVDA) | 0.0% | 27.6% | 27.6% | 5.00% | 0.0% | 1.4% | 1.4% |
| GOOGL | 0.0% | 12.9% | 12.9% | 2.00% | 0.0% | 0.3% | 0.3% |
| CRWD | 0% | 24.50% | 24.5% | 2.50% | 0.0% | 0.6% | 0.6% |
| Meta | 0.4% | 18.80% | 19.2% | 2.00% | 0.0% | 0.4% | 0.4% |
| Total | 100.00% | 3.6% | 10.7% | 14.3% |
(Source: FactSet Research)
This updated allocation keeps the dividend yield at almost 4% but boosts long-term growth potential, total returns, and income growth by 1% annually.
- Over my time frame of 70 years, that’s a potential 100% higher inflation-adjusted return.
SCHG is my previous growth ETF, and I consider IWY slightly better.
- If you own other growth ETFs, do not sell them without considering tax implications
- the benefits of IWY vs. QQQ (bought years ago) are minimal
- the capital gains taxes will more than offset them
Let me say this again, so there is no misunderstanding.
I am not saying you personally should sell SCHG if you own it today.
- minimal tax implications for me personally right now
- your situation might be completely different
- never blindly mirror what I do
- I am not ever, ever, ever, giving personal investing advice to any reader
My goal is to own the best ETFs for my family fund’s needs, and that means a concentrated portfolio of blue-chips that target whatever we are trying to target.
- the best blue high-yield blue-chips for the high-yield allocation
- the best growth stocks for the growth allocation
- the best deep-value stocks for value allocation
Alex Gallanis
Look at the historical returns of IWY vs its growth ETF peers.
They are modestly better, with a 16% annual return over ten years compared to 13.2% to 15%.
The main difference is that IWY is concentrated and weighs by growth.
Specifically, IWY ranks the 200 largest companies in the US by growth.
- 2 year forward consensus EPS growth from Refinitiv
- 5-year backwards sales growth
Then it selects the 100 (currently 112) fastest-growing companies and weights them by growth.
The Nasdaq QQQ takes the 100 largest Nasdaq companies. No screening for growth at all.
For a decade, it hasn’t mattered because the biggest companies were the fastest growing.
But imagine Apple’s growth rate falling to 5%. If the stock price didn’t fall, the Nasdaq 100 would still weight it at over 10%.
- Say due to copious buybacks
The growth powerhouse of the Nasdaq 100 (QQQ) in the future might become something that doesn’t grow much faster than the S&P.
On the other hand, growth ETFs that screen for growth? They will always be the best source of large-cap (wide moat and strong balance sheet) growth.
Something like VONG (Russell 1000 growth ETF) takes the 500 fastest-growing US companies (among the 1000 largest).
OK, but why do I want to own 500 fast-growing companies when I can own 112 fast-growing companies weighted by growth instead of market cap?
Does owning a few hundred companies in minute amounts that don’t generate superior returns matter?
Bessminder et Al
As little as 15 stocks can give you 90% of the benefits of diversification.
Owning 100 stocks is more than enough; owning 1000 or 10,000 won’t improve your results; it’s what Buffett calls “de-worsification.”
Since 1926, there have been 28,121 US stocks that generated 55 trillion dollars in gains. Fifty trillion came from the top 2% or $560 companies. Apple generated the most 5% of all stock profits since 1926
Ritholtz Wealth Management
The Vanguard total world stock ETF (VT) owns 10,000 companies.
But the historical data is clear: Even in the US, the best-performing stock market of the last 200 years, 60% of stocks never generate long-term profit.
- the top 3 generated 10% of profit
- Apple alone = 5% of all stock market profits from 1926 to 2022
- the top 2% of companies are all that really matter
Why?
JPMorgan Asset Management 
44% of US stocks from 1980 to 2021 fell 70% or more from record highs and never recovered.
A 100-stock portfolio like SCHD or IWY, or COWZ is more than enough diversification for exposure to a strategy like high yield, growth, or deepest value.
SPGP targets just 75 stocks, which is why I’m bringing the number of stock ETFs down to 4.
Fine-Tuning Trade 4: Selling OMFL At A Profit And Putting Proceeds Into COWZ And SPGP
First, let me show you my net holdings with just 4 ETFs.
The Reason I Want To Own A Handful Of ETFs (Though You Might Want To Own More)
| ETF | Holdings | COWZ | SPGP | SCHD | IWY | Total Overlap |
New Companies |
| COWZ | 100 | NA | 27 | 16 | 18 | 61 | 39 |
| SPGP | 75 | 27 | NA | 10 | 20 | 57 | 18 |
| SCHD | 104 | 16 | 10 | NA | 14 | 40 | 64 |
| IWY | 110 | 18 | 20 | 14 | NA | 52 | 58 |
| Total | 389 | 61 | 57 | 40 | 52 | 210 | 179 |
(Source: ETFrc.com)
BAM, ENB, and BTI are not owned in any of these ETFs, and thus, brings my total number of companies to 182, down from the original 1,200 when I designed this portfolio.
Concentration in the best companies will likely improve returns and make no difference in volatility, thus improving the key metrics this portfolio was designed to maximize.
- Sortino ratio: excess total returns (over risk-free treasury) divided by negative volatility
- Treynor ratio: excess total returns divided per unit of volatility
Notice how 4 ETFs with 389 companies only own 179 when accounting for overlap.
Next, you might wonder why OMFL is getting sold. Is it because it’s a bad ETF? No, the Invesco Russell 1000 Dynamic Multifactor ETF (OMFL) has wonderful historical returns.
Historical Returns Since June 2019 (When SPGP adopted its current benchmark)
Portfolio Visualizer Premium 
OMFL slightly beat the S&P and underperformed COWZ and SPGP.
Historical returns are especially important for strategy ETFs like these, where the portfolio changes every year (sometimes more than once).
- You can’t guess what COWZ, SPGP, or OMFL will own in 2 or 3 years,
Owning any ETF like this is a 100% investment in the underlying portfolio strategy.
OMFL takes the Russel 1000 and then weights by value, quality, momentum, etc, (factor investing) based on Invesco’s economists’ estimate of where we are in the market cycle.
SPGP takes the S&P 500 and then selects the 150 fastest growers.
- 3-year forward EPS growth consensus
- 5-year backward sales growth
It then applies the following screen to the remaining companies (fast-growing large caps).
- debt/EBITDA (balance sheet strength)
- return on equity (profitability = Wall Street’s favorite quality metric)
- PE ratio (value)
The PE ratio isn’t the best valuation metric, but it’s nice that SPGP factored in safety, quality, and valuation and then applied it to the 30% fastest-growing S&P companies.
It takes the other three factors and combines them into a GARP index score, selecting the top 50% of fast-growing companies to develop a 75-stock portfolio.
- this is what the index does
- SPGP just tracks the index (It’s not actively managed)
Pacer
FCF/EV, or free cash flow yield, is the best-performing valuation metric of the last 33 years.
- FCF yield combines valuation with quality
It’s the truest form of valuation, using Buffett’s “Owner earnings” to screen for the best large-cap blue chips trading at the best prices.
Pacer
COWZ takes the Russell 1000 (its index does) and then screens for the top 10% of companies based on 12-month trailing free cash flow divided by (market cap + debt minus cash).
- enterprise value = the true cost to buy a company
It then weights the 100 stocks by FCF yield with a 2% risk cap.
There are more concentrated versions of this strategy (VFLO uses just 50 stocks); however, they don’t have the track record that COWZ has.
- VFLO uses forward FCF yield and also cuts out the 33% slowest growing companies
- as determined by their own analyst’s models
In other words, while a 50-stock portfolio using the above deep value strategy sounds great in theory, if VFLO’s forward-looking models are wrong, then you could be concentrating your deep value allocation into stocks that might neither be growing quickly nor very undervalued.
Historical Returns Since Dec 2017 (When OMFL launched)
Portfolio VIsualizer Premium 
Since its beginning, OMFL has beaten the S&P and even COWZ and has impressive, advanced metrics (like the Sortino ratio).
Portfolio VIsualizer Premium 
How can a deep-value ETF allocation not include the single best deep-value ETF I’ve ever found? I need to own COWZ because it best fulfills the mission of the deep value ETF bucket.
SPGP is so impressive an ETF that its getting its own article coming in a few days.
- Comparing and contrasting (head to head) with a great deep value ETF that a DK member has asked about
Notice how COWZ and SPGP (who collectively own less than 175 companies vs OMFL’s 375.
If you could earn 13% to 14% returns using ten stocks or two stocks, which would you prefer? Assuming you’re already diversified in the rest of your portfolio, less stock = better, less time to rebalance.
- Every single extra ticker takes more time each day to track this portfolio in real time for DK members
- owning as few tickers as possible = logistical/convenience preference for me
In other words, OMFL IS NOT a “SELL” just because I’m selling it. It’s just that being 5.55% in COWZ and SPGP rather than 3.7% in 3 deep value stocks is a better choice for my needs.
What The Portfolio Looks Like Now
Morningstar
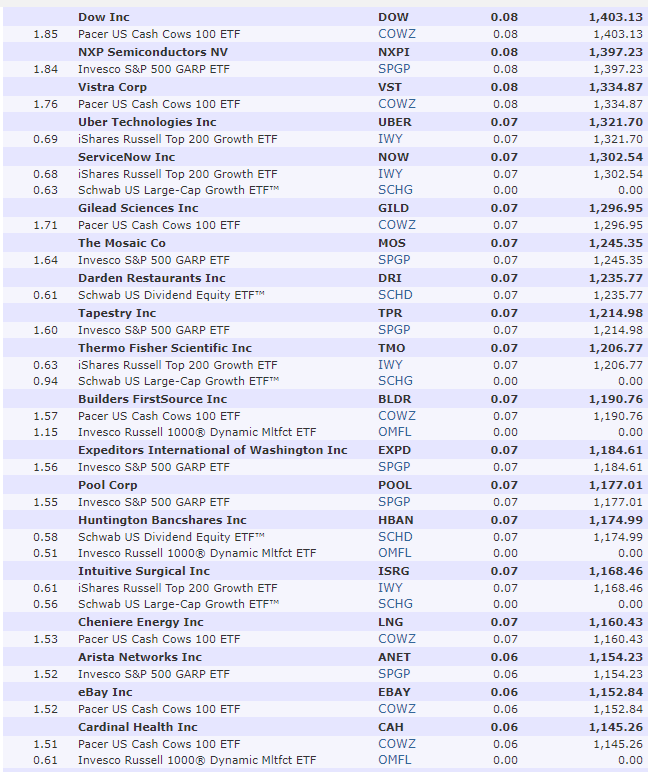
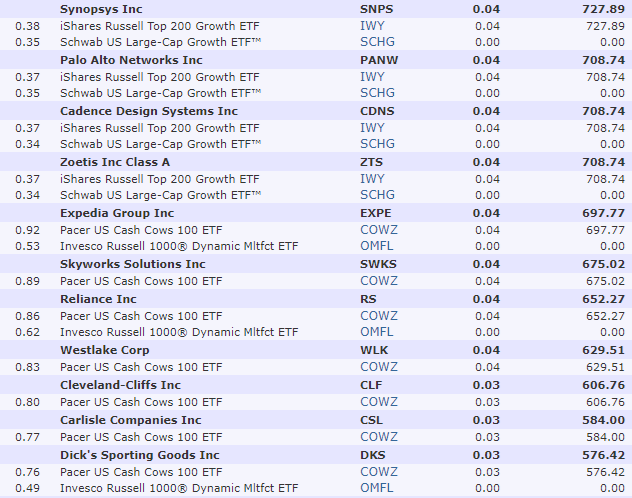
The 182 Companies I Now Own
Morningstar Premium Morningstar Premium Morningstar Premium Morningstar Premium Morningstar Premium Morningstar Premium Morningstar Premium Morningstar Premium Morningstar Premium Morningstar Premium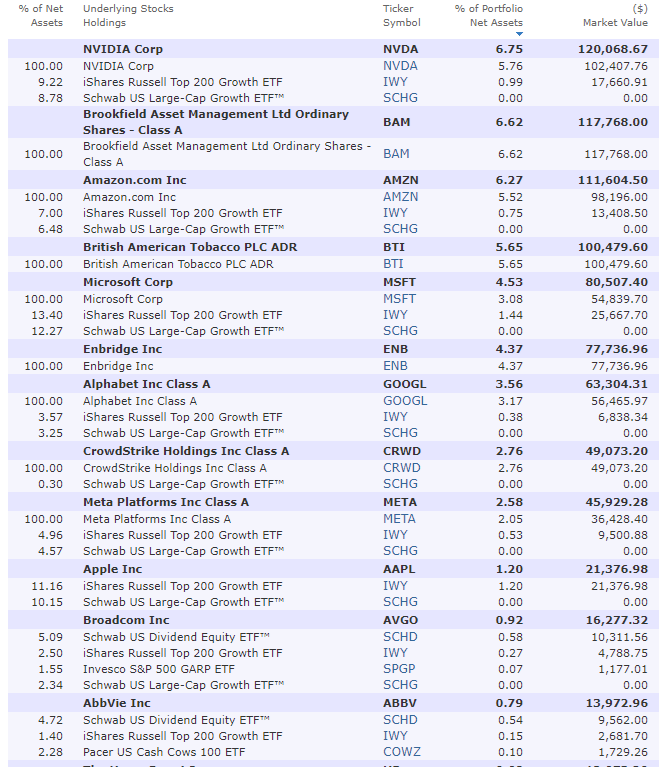


What about the portfolio fundamentals?
Morningstar Premium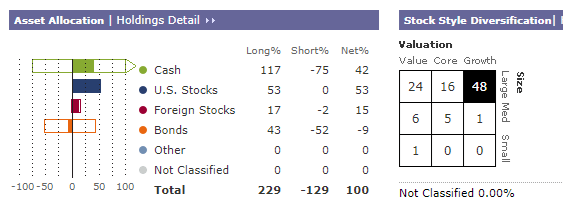
A perfect balance between growth and value/yield.
A focus on large, mature, and low-risk companies.
Morningstar Premium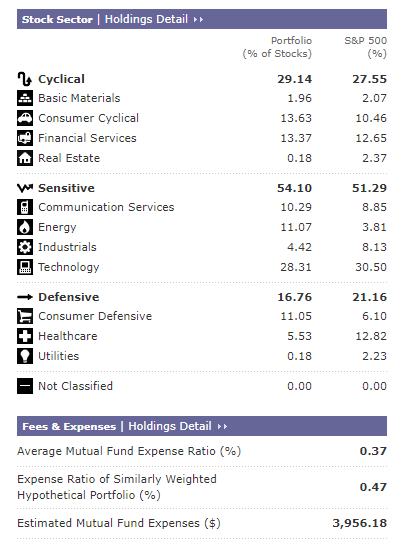
No sector has more than 30% of the portfolio, though “big tech” is multi-sector and represents about 52%.
Morningstar Premium
Morningstar estimates that the stocks in the portfolio (70%) are growing at 16.3% and trading at 6% undervalued.
- 19.4 historical fair value per Morningstar’s estimate
- 7% upside to fair value (not counting any future growth)
- 11.4% weighted EPS growth for the portfolio
- 3.6% yield (including hedges)
- 15.0% CAGR 5-year Morningstar total return potential
- 1.3% valuation boost
- 16.3% CAGR 5-year Morningstar total return forecast
For a volatility high-yield hedge fund that historically falls 38% less than the S&P during downturns, the ability to potentially earn 16% to 17% returns for the next five years and 16% to 17% income growth is very attractive.
Bottom Line: These Are The Final Fine-Tuning Trades To Get ZEUS Family Ready For Real-Time Tracking
Again, I am not a market timer, and I am not giving anyone reading this personalized investment advice.
Everything I do for the ZEUS Family fund is real money, and members receive email notifications when trades occur.
Every Thursday, you can see a summary of any trades and how the portfolio performs against its benchmark, the hedge fund industry.
- represented by HFND, Bridgewater veteran manager Bob Elliott’s ETF, which charges 2% expenses (60% less than hedge funds)
Sharesight Premium 
I hope this article can make clear why:
- I am bullish on NVDA (and thus 5.5% max overweight)
- Bullish on BAM (and thus 6.6% max overweight)
- Seeking to run as concentrated a portfolio as possible (still 182 great companies is plenty diversified), thus consolidating OMFL into SPGP/COWZ in my deep value ETF allocation.
- Replacing SCHG (a great growth ETF) with a more concentrated growth ETF IWY
I hope future portfolio updates will provide useful insights into prudent and responsible risk management and long-term investing. This way, you can let the world’s best companies work hard for you so that one day, you won’t have to.