
The U.S. economy keeps limping along. There are no clear signs of a recession, but it is pretty clear that the top of this business cycle is behind it. The question now is: are we looking at a bona fide economic downturn, or just a ‘breather’ with a smooth comeback after the summer?
I will return to this question in a separate analysis when we have labor-market and inflation data for February. In the meantime, there is a more pressing question to be answered, one that the U.S. Congress needs to pay urgent attention to: why are investors in the market for U.S. debt less and less interested in buying that debt?
I am not sounding the alarm—there is no imminent risk for a U.S. debt crisis—but I am pointing to a worrisome trend in the market that has now lasted for a month. That is a long time in these fast-moving markets.
To see what this troubling trend is, let us start with Figure 1. It reports the yields (interest rates) on two U.S. Treasury securities: the one that matures in two years (black lines) and the five-year one (green lines). The solid lines represent the yield that investors get when they buy these securities at the Treasury auctions, i.e., where the Treasury sells them to investors; the dashed lines represent the yield in the secondary market, i.e., where everyone can buy them.
Figure 1
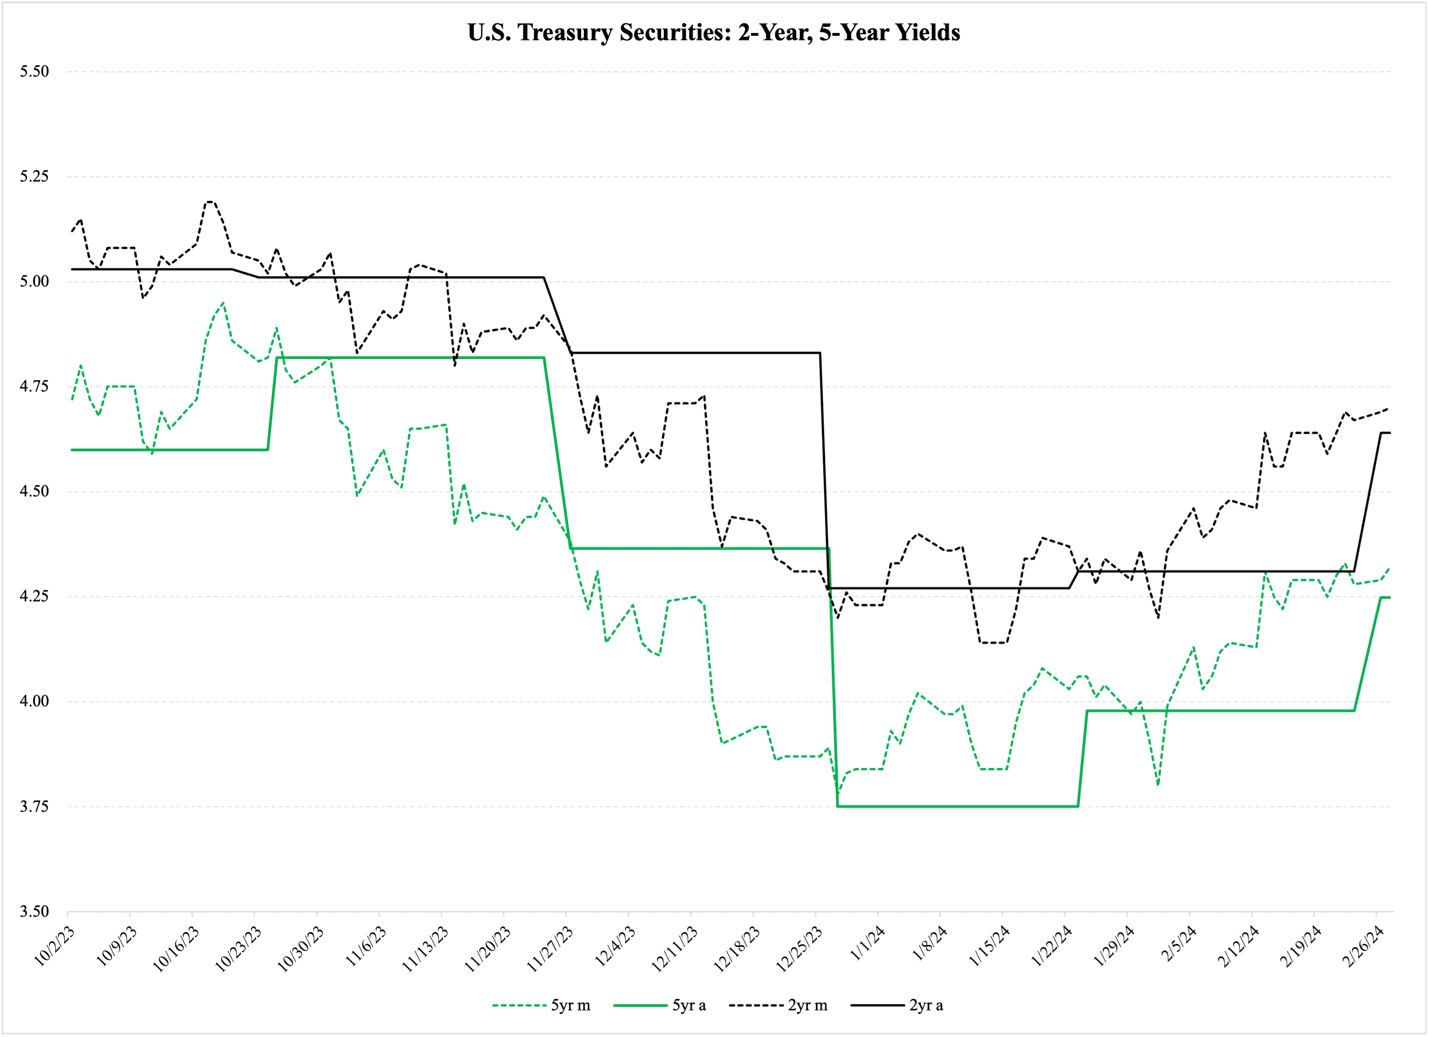
Looking at the market-based yields, i.e., the dashed lines, we find a small, gently cantering decline beginning in late October. At the end of November, the U.S. Treasury sells new debt under the 2- and 5-year maturities at lower yields (the “drop” in the solid lines). The cut is not extraordinary in any way, but it comes at just the right time to accelerate the rate drops in the secondary market.
At the next monthly auction for new 2- and 5-year debt, interest rates drop further. This time, the drop adjusts to where yields in the secondary market are. For the next month, yields are relatively stable until rates start rising again in early February.
When the Treasury sold new debt on February 26th, the yields on both these maturities increased. The 2-year rose from 4.31% to 4.64%, while the 5-year leaped from 3.75% to 4.248%.
These are not the only Treasury securities with rising yields. The 7-year note has been through a similar cycle, with its yield bottoming out at 3.78% in late December; at the auction on February 27th, it sold at 4.27%. A week earlier, the 20-year bond paid 4.51% after having auctioned at 4.15% two months before.
Yields are on the rise for one simple reason: Congress and President Biden are completely ignoring the federal debt. The media don’t talk about this very much—not even supposedly economically savvy news outlets like Bloomberg, Fox Business, or the Wall Street Journal pay any attention to the debt—but I do. And so do investors. And like me, they can do arithmetic.
From the start of the 2024 fiscal year on October 1 to February 28th, the U.S. government debt has increased by $934.2 billion. This is a ‘debt speed’ of $188.6 billion per month; if we extrapolate this trend over the next seven months, then by the end of the 2024 fiscal year the United States government will have grown its debt by $2,263.7 billion.
That is $2.26 trillion. In other words, in one year Congress will borrow as much money as the gross domestic product of Belgium, the Netherlands, and Sweden combined.
In the past, I have pointed to signs that investors in U.S. debt are getting uneasy. The continued rise in interest rates shows that they are still in that mood; add to that the continued decline in the tender-accept ratio, i.e., the ratio between how much money investors offer at Treasury auctions and how big of a debt the Treasury wants to sell.
Figure 2 shows three phases in the U.S. debt market so far this fiscal year. Pay special attention to the third of those phases:
Figure 2
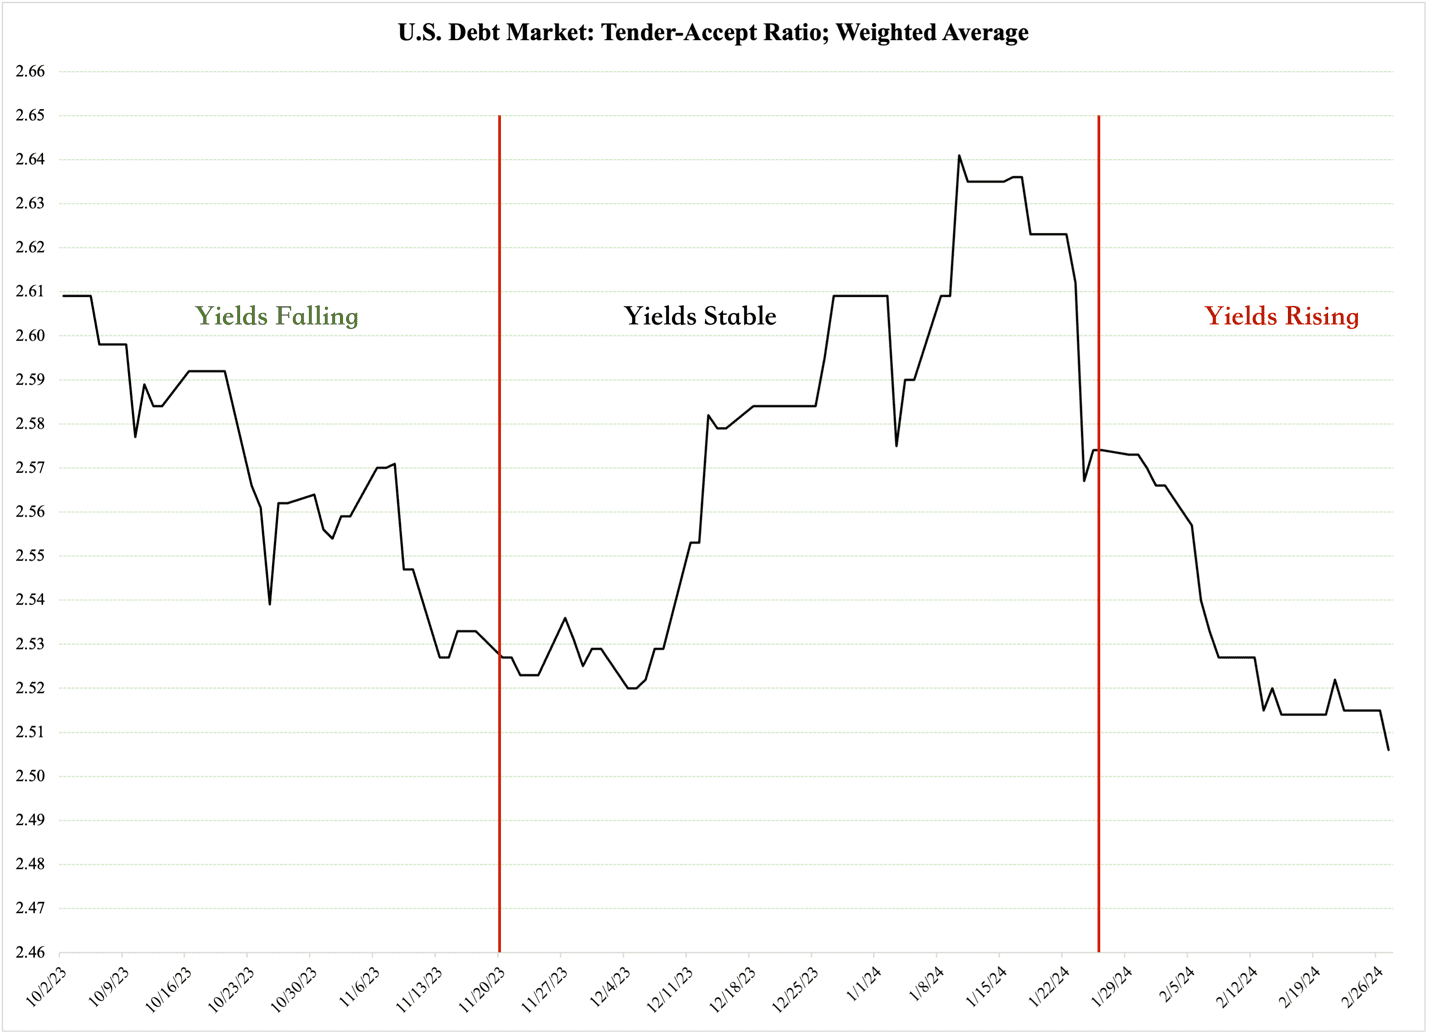
In the first phase, the falling T/A ratio was combined with falling interest rates. This means that the market is calm: while investors are putting less money into the market per $1 of debt that the Treasury wants to sell, they have faith in the ability of the Treasury and Congress to manage the U.S. debt. This is the quiet phase.
In the second phase, the T/A ratio is rising again, while yields are stable. This means that investors once again are putting more money into the market, given the new debt that the Treasury is offering at its auctions. We could call this the resilient phase.
Then comes the third phase. Like the first phase, the T/A is falling again, but this time interest rates are rising simultaneously, with investors offering less money per $1 of auctioned debt. This means that, even though investors are getting a higher return per dollar they invest, they are less interested in each new dollar of debt than they were in phase 2.
A blunt way of interpreting this is to say that investors have soured on U.S. debt and won’t be persuaded into optimism even as yields are rising. I would not go this far—generally speaking, the market for U.S. debt is both stable and liquid—but there is no doubt that the combination of rising yields and a falling T/A ratio is a stern signal from investors to Congress: get your fiscal house in order, or you will see more of the same.
In fairness, investors do have other reasons to worry about owning U.S. debt. Inflation is one of them: according to the U.S. Consumer Price Index (CPI), inflation has stalled in the 3-3.5% bracket since October last year. According to three economic indicators, it should be falling further. The first is the Producer Price Index (PPI), which has been negative since September last year: over the past four months, producer prices in the U.S. economy have declined by 3-4% compared to a year earlier.
Generally, consumer prices follow producer prices with a two-month lag, which means that we should be seeing a lower consumer-price trajectory than we currently do. The fact that we are not seeing this is troubling, but it is not a reason to expect higher inflation going forward. One reason is likely a structural change in the market for consumer products: during the COVID pandemic, when many U.S. states forced local businesses to shut down, smaller retail businesses competing with big-box stores were wiped out. When the economy opened up again, that competition was gone, leaving big-box stores with more wiggle room to set prices as they see fit.
In short, the competition-based markup on producer prices has increased. It takes deeper PPI inflation to bring CPI down.
Investors in the debt market have some reason to be concerned about inflation, but nowhere near enough to cause the uneasiness we are currently witnessing.
The second reason for them to worry is that the U.S. economy is not growing very strongly. The revised GDP data for the fourth quarter of last year show an inflation-adjusted growth rate of 2.94% for the fourth quarter. This is not a bad number per se, especially since the three previous quarters showed slower growth. However, the trend in GDP is flattening out, and the fourth-quarter number is predominantly driven by government spending, which grew by 4.1%.
When government outlays drive the economy, it is a safe bet that either taxes or deficits will rise as well. Both are reasons for debt-market investors to worry.
The third reason for that same worry is that U.S. unemployment in January rose to 4.1%, up from 3.5% in November and December. This increase is small, but it is the highest number since October 2021, and it is combined with an abysmal 1.2% annual growth in weekly paychecks. For comparison, in pre-pandemic 2019, weekly paychecks grew by almost 2.9%.
A weaker labor market signals a downturn in the economy in the near future. So far, it does not look like this will be more than a ‘breather’ as opposed to a recession, especially if inflation ticks down a little bit, and the Federal Reserve cuts its interest rate no later than June. However, investors in the debt market can read more into the weakening labor market than I do, which would add to their growing reluctance to buy U.S. debt.
Regardless of what weight investors attach to macroeconomic variables, their immediate concern is always the yield on the debt they buy, and the reliability of that stream of yield payments. Therefore, the combination of rising yields and a falling T/A ratio is a sufficiently large wake-up call for Congress to part with old habits and, for once, take proactive measures to end their endless budget deficit.