
Expectations for Fed policy and therefore the movement of bond yields continue to be a main driver of sentiment for global markets. Sure, other things are happening in the world but, for now at least, it’s the theme markets always revert to when given half a chance.
Market pricing is less confident of several Fed cuts this year, yet still they’re trying to price them in. Fed fund futures currently imply that the Fed’s target range will remain at 5.25% – 5.50% over the next two meetings, with a 51.8% chance of their first cut in June with odds of subsequent cuts quickly diminishing below 50% further out. But you can bet that they’ll quickly reprice multiple cuts if economic data for the US turns south.
But what I am looking at today is market positioning of the 2-year bond note from the weekly COT report, as it can help decipher where these futures traders see yields in the future. The 2-year note is used as the 2-year yield is widely used as a gauge for Fed policy expectations.
US 2-year note, large speculator positioning form the COT report:
- Net-short exposure to the 2-year note has diminished to a 24-week low, yet still remains stretched by historical standards
- Short bets have been reduced by -17.4% since its peak in November, gross long exposure remains subdued
- If net-short exposure continues to diminish, it suggests yields could drop
- In 2023 the 2-year yield flatlined above 5% despite net-short exposure rising aggressively into its record high – what’s the say yields should simply surge to new this this time around, if short-interest is diminishing?
As this is a weekly chart it smooths out the day-to-day headlines. And a clear trend to my eyes is that net-short exposure among large speculators is diminishing, due to a culling of short bets. And despite the -17.4% drop in shorts since the November peak, it could still be argued that bearish positioning remains stretched; it’s record high of net-short exposure was over six standard deviations from the mean (-6SD), and even with net-short exposure at a near 6-month low, bearish positioning remains ~5SD from the mean. In a nutshell, bears may still be too bearish considering the Fed are most likely done within hiking interest rates, and the latest upswing in might be capped to below the 2023 peak.
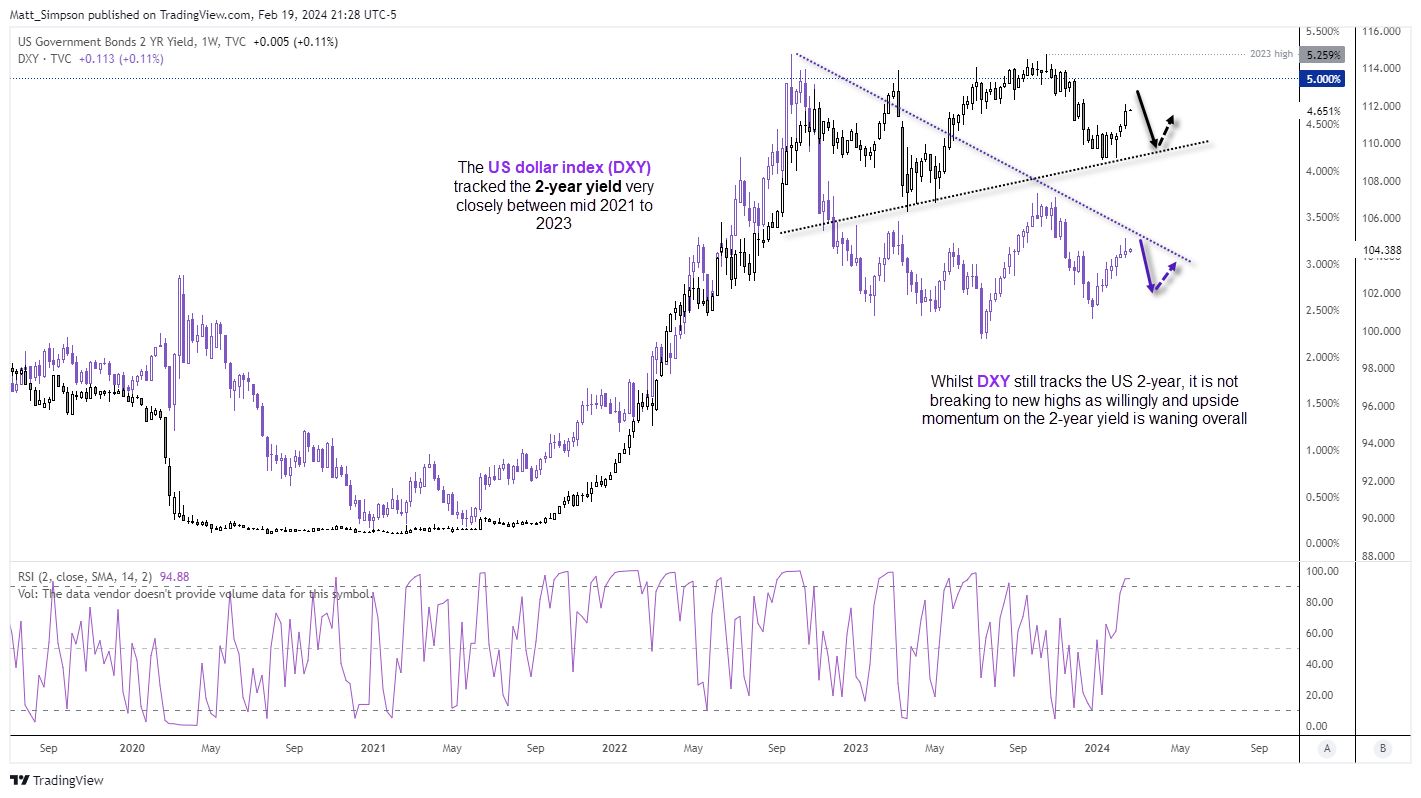
US dollar index, US 2-year yield technical analysis:
With US economic data remaining firm overall, there’s nothing to say that the 2-year yield cannot rise further from her. Yet I now remain doubtful that it will break above the 2023 highs. RSI (2) is overbought on the weekly chart, so I am now looking for evidence of a swing high on the 2-year yield. And whilst this correlation with the US2yr and US dollar index is not as pristine as it was in 2022, lower yields could surely weigh on the US dollar index at least to a degree.
But to become convincingly bullish the 2-year note (which should be bearish for the 2-year yield and US dollar), the wheels likely need to fall off of the economy sooner than later to enable multiple Fed cuts to be re-priced. As I remain sceptical of that, the bias is for a retracement on the US dollar once yields have completed their current rebound, but for the US dollar index to hold above the December low. From there, price action could be choppy for both markets as markets try to decipher the Fed’s actions in H2.
— Written by Matt Simpson
Follow Matt on Twitter @cLeverEdge