
blackdovfx
In our previous review of Microchip Technology Incorporated (NASDAQ:MCHP), we focused on the company’s consistent growth in product segments. We observed that while Microchip boasted an extensive range of over 25,000 products in its MCU segment, it faced challenges in performance compared to industry peers such as Texas Instruments (TXN) and NXP (NXPI). In the analog market, Microchip ranked third in product breadth but struggled to compete with market leaders like TI and ADI (ADI), holding only a 2.4% market share. Furthermore, despite having a significant number of products in FPGAs, Microchip’s performance trailed behind competitors like Intel and Xilinx.
In this current analysis, we aim to assess whether Microchip is experiencing a downturn, evident in its slowed revenue growth rate of 1.2% based on TTM data and weak projected guidance with a decline of 9.5%. We examined the reasons behind this slowdown in Microchip’s primary product segments, drawing insights from management’s statements. Additionally, we analyze the growth trajectories of Microchip’s key competitors in the DAO market, comparing them with trends in the logic and memory markets. Finally, we evaluate Microchip’s competitive position through an analysis of market share and ongoing product developments,
Revenue Growth Slowdown
First, we examine Microchip’s revenue growth trend to analyze whether all of its main product segment growth was slowing down.
|
Quarterly Revenue Breakdown (CY) ($ mln) |
Q1 2023 |
Q2 2023 |
Q3 2023 |
Q4 2023 |
CY 2023 |
|
Microcontrollers |
1,291.9 |
1,301.7 |
1,280.1 |
995.2 |
4,868.9 |
|
Growth (%) |
23.5% |
22.5% |
8.5% |
-18.5% |
8.0% |
|
Analog |
617.9 |
633.6 |
623.0 |
430.6 |
2,305.1 |
|
Growth (%) |
19.8% |
9.2% |
8.8% |
-29.0% |
1.3% |
|
Other |
323.5 |
353.3 |
351.0 |
339.9 |
1,367.7 |
|
Growth (%) |
14.5% |
10.4% |
9.3% |
-0.4% |
8.1% |
|
Total Revenue |
2,233.3 |
2,288.6 |
2,254.1 |
1,765.7 |
8,541.7 |
|
Total Growth (%) |
21.1% |
16.6% |
8.7% |
-18.6% |
6.1% |
Source: Company Data, Khaveen Investments
The table above shows the slowdown in revenue growth in all segments. In particular, all segments have reported negative growth in Q4 CY2023, with Analog experiencing the steepest decline since Q1 2023, with a growth rate of -29%. The Other segment had a negative change in revenue growth from Q1 to Q4 of 14.9%, as it also slowed down. Furthermore, the company’s management guided a decline in revenue for FY2024 of approximately 9.5%. As mentioned by the management:
All regions of the world and most of our end markets were weak. Our business was weaker than we expected as our customers continue to respond to the effects of increasing business uncertainty, slowing economic activity and a resultant increase in their inventory. – Ganesh Moorthy, President and CEO
We examine whether the slowdown in Microchip’s revenue was due to the factors mentioned by the CEO above:
- Business Uncertainty
- Slowing Economic Activity
- Increase in Customer Inventories
The Composite US Purchasing Managers’ Index (PMI) has improved with an increase since August of 2023, rising from 50.2 to 52.3 in January this year which indicates a recovering business manufacturing outlook that indicates improving business sentiment.
Furthermore, we analyzed the overall economic activity by looking at GDP growth. In our previous analysis of ADI, we highlighted that the GDP growth outlook had improved throughout 2023 as the average GDP growth was revised higher to 2.8% compared to 1.9% initially at the start of the year. Furthermore, the average GDP growth projection for 2024 remained stable at 2.7%, thus we believe is not the primary factor for the company’s slowdown. Furthermore, in our analysis in ADI, we highlighted that the end market inventories in the PC and smartphone markets have been recovering as in the second half of 2023, though other end markets such as automotive and industrials face headwinds due to excess production and slowing industrial activity.
Overall, the company’s revenue growth had been slowing down sharply as seen by its latest quarter which contracted across all segments including Microcontroller and Analog. However, we believe that the reason for its slowdown is not primarily due to business uncertainty, slowing economic activity, or an increase in customer inventories as we highlighted the improving PMI index, stable economic growth outlook, and a mixed end-market situation with improving customer inventories in PC and smartphone end markets but a deterioration in automotive and industrial. Therefore, we examine the other potential reasons to explain the company’s slowdown in the following section by examining the semicon industry and top companies within each market’s growth.
DAO Market Recovery Expected in the Second Half
We have gathered the quarterly revenue data of Microchip and its main competitors within the DAO market.
|
Top DAO Companies’ Quarterly Revenue ($ mln) |
Q1 2023 |
Q2 2023 |
Q3 2023 |
Q4 2023 |
4Q Average |
2024F |
2025F |
|
Microchip |
2,233 |
2,289 |
2,254 |
1,766 |
7,730 |
6,250 |
|
|
Growth (% YoY) |
21% |
17% |
9% |
-19% |
7% |
-9.50% |
-19.15% |
|
Texas Instruments |
4,379 |
4,531 |
4,532 |
4,077 |
15,648 |
17,986 |
|
|
Growth (% YoY) |
-11% |
-13% |
-14% |
-13% |
-13% |
-10.68% |
14.94% |
|
ADI |
3,250 |
3,263 |
3,077 |
2,717 |
10,006 |
11,194 |
|
|
Growth (% YoY) |
21% |
10% |
-1% |
-16% |
3% |
-18.69% |
11.88% |
|
STMicro (STM) |
4,247 |
4,326 |
4,431 |
4,282 |
16,116 |
17,584 |
|
|
Growth (% YoY) |
20% |
13% |
3% |
-3% |
8% |
-6.77% |
9.11% |
|
NXP |
3,121 |
3,299 |
3,434 |
3,422 |
13,061 |
14,191 |
|
|
Growth (% YoY) |
-0.5% |
-0.4% |
-0.3% |
3% |
1% |
-1.62% |
8.65% |
|
Infineon (OTCQX:IFNNF) |
4,469 |
4,462 |
4,386 |
3,702 |
16,546 |
18,623 |
|
|
Growth (% YoY) |
22% |
18% |
8% |
-12% |
9% |
-2.78% |
12.55% |
|
Total |
21,698 |
22,170 |
22,114 |
19,965 |
79,106 |
85,827 |
|
|
Growth (% YoY) |
9.8% |
5.1% |
-0.6% |
-9% |
1% |
-8.0% |
8.5% |
Source: Company Data, Khaveen Investments
Based on the table above of the top DAO companies including Microchip, the total revenues in the past 4 quarters in 2023 indicate the decelerating growth rate from 9.8% in Q1 2023 to -9% in Q4 2023. Among these companies, Microchip, Infineon, STMicro and ADI growth had slowed down every quarter and turned negative by Q4 except for ADI and STMicro which declined since Q3. However, TI’s performance contrasts with its competitors as its growth had been contracting in all of the 4 past quarters while NXP’s growth was flattish but rebounded slightly in Q4.
Therefore, we believe the slowdown of Microchip is attributable to the market weakness within DAO as its growth slowed down as the DAO market deteriorated.
|
Semicon Segment Revenue Comparison ($ mln) |
Q1 2023 |
Q2 2023 |
Q3 2023 |
Q4 2023 |
4Q Average |
2023 |
2024F |
2025F |
|
DAO |
21,698 |
22,170 |
22,114 |
19,965 |
85,947 |
79,106 |
85,827 |
|
|
Growth (% YoY) |
9.8% |
5.1% |
-0.6% |
-9.5% |
1.2% |
-8.0% |
8.5% |
|
|
Logic |
24,260 |
31,815 |
38,078 |
41,574 |
135,727 |
211,753 |
297,531 |
|
|
Growth (% YoY) |
-25.4% |
11.3% |
41.9% |
61.8% |
22.4% |
56.0% |
40.5% |
|
|
Memory |
14,270 |
16,041 |
18,806 |
25,124 |
74,240 |
104,921 |
128,963 |
|
|
Growth (% YoY) |
-55.6% |
-54.2% |
-28.9% |
31.9% |
-26.7% |
41.3% |
22.9% |
|
|
Total |
60,228 |
70,025 |
78,998 |
86,663 |
295,914 |
395,780 |
512,321 |
|
|
Growth (% YoY) |
-28.7% |
-17.3% |
4.6% |
29.8% |
-2.9% |
33.7% |
29.4% |
Source: Company Data, Khaveen Investments
Based on the table of the total revenue of top companies within DAO, Logic and Memory, the DAO market deteriorated every quarter with lower growth. However, in comparison, the Logic and Memory market had improving growth in each quarter. For Logic, the total growth turned positive by Q2 2023 (11.3%) and accelerated through Q4 2023. Though, the Memory market recovered to positive growth later only in Q4 2023.
For the Logic market, we previously highlighted the PC market recovery in the second half of the year which we believed contributed to Logic semicon recovery as 64% of the PC market is Logic. Moreover, the top cloud providers’ capex growth also improved in H2 as we highlighted increasing AI investments. Additionally, in the memory market, we highlighted the stabilization of market ASPs as top memory chipmakers cut supply growth to balance the market as market ASPs started rising in Q4 2023.
In comparison, as PC and ICT Infrastructure (Data Center) markets represent a relatively smaller % of DAO (18% and 17% respectively), we believe this did not benefit the DAO market growth significantly. Additionally, analog ASPs of the company according to the annual report are relatively stable. Instead, we believe the main reason for the decline in the DAO market is due to China’s weakness. In our previous analysis of ADI, we highlighted that the top analog chipmakers’ China revenue exposure experienced significant weakness (-11%) as chip imports declined in the country amid “China’s weak smartphone and laptop sales” which we believe is the primary reason for the DAO market slowdown.
Overall, we believe the company’s slowdown is primarily attributed not to internal reasons but to a market-wide weakness in the DAO market whose growth rate had slowed down in each consecutive quarter in 2023. This is in contrast with the recovery in Logic and Memory markets which returned to positive growth, indicating the different cycles in each market within the semicon industry. We attributed the slowdown in DAO to China’s weak economy, as top analog chipmakers experienced a significant decline in revenue in 2023 due to the shrinking PC and smartphone markets in China.
Company Data, Khaveen Investments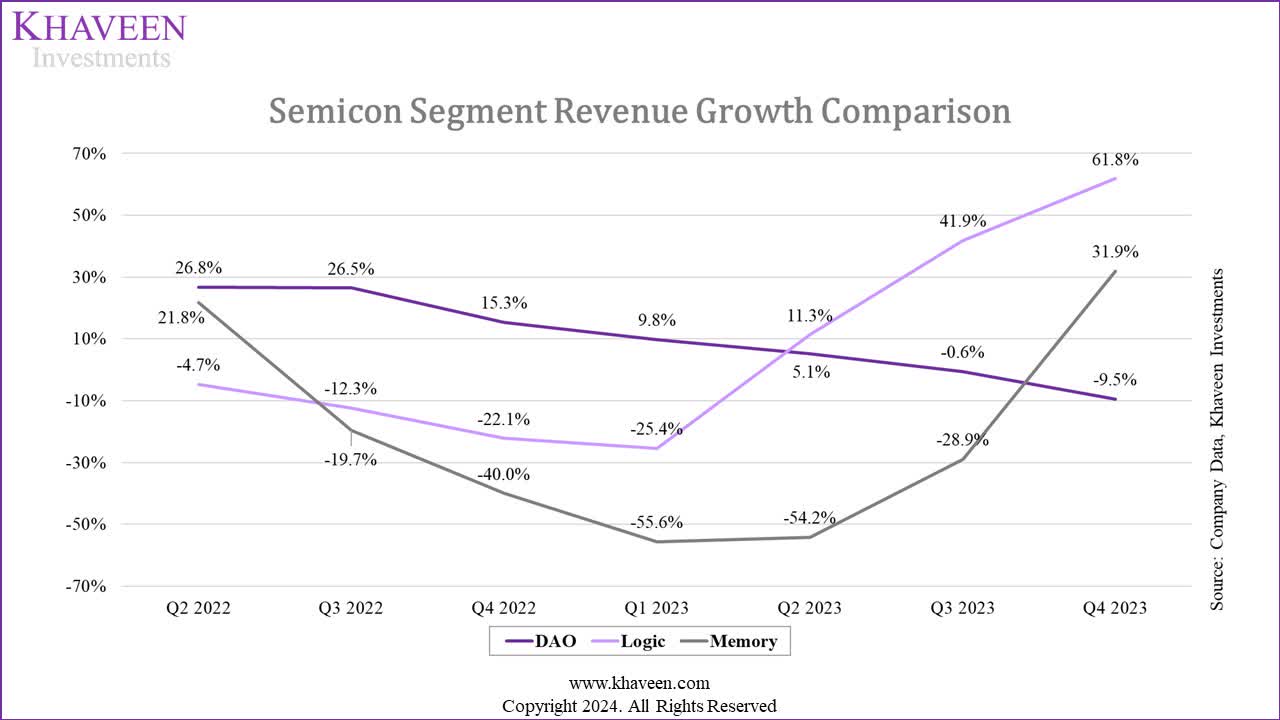
Based on the chart provided above, we see that the Logic segment had the quickest recovery, followed by the Memory segment. However, the DAO segment is still on a downward trend. Moreover, we identified that it took Logic 4 quarters to start recovering (Q1 2023), and an additional quarter to show positive growth. On the other hand, Memory took 5 quarters to start recovering (Q2 2023), and another 2 quarters to fully recover. From this analysis, we anticipate the DAO segment growth to bounce back in approximately 4 quarters (Q2 2024) and to fully recover in the following one or two quarters (Q3-Q4 2024).
Microchip Competitiveness and Growth Outlook
For this point, we compiled the company’s market share in the MCU and analog markets and analyzed its competitiveness.
|
Revenue Breakdown by Product Line ($ mln) (FY) |
2019 |
2020 |
2021 |
2022 |
2023 |
4Y Average |
|
Microcontrollers |
2,922 |
2,818 |
2,961 |
3,815 |
4,756 |
|
|
Growth (%) |
– |
-3.6% |
5.1% |
28.8% |
24.7% |
13.8% |
|
Analog |
1,531 |
1,511 |
1,520 |
1,939 |
2,377 |
|
|
Growth (%) |
– |
-1.3% |
0.6% |
27.6% |
22.6% |
12.4% |
|
Other |
897 |
945 |
958 |
1,067 |
1,306 |
|
|
Growth (%) |
– |
5.4% |
1.3% |
11.4% |
22.4% |
10.1% |
|
Total Revenue |
5,350 |
5,274 |
5,438 |
6,821 |
8,439 |
|
|
Total Growth (%) |
-1.4% |
3.1% |
25.4% |
23.7% |
12.7% |
Source: Company Data, Khaveen Investments
From the table above, we saw an upward trend in revenue growth for all segments of Microchip, with total growth increasing from -1.4% to 23.7% in 2023. In addition, Microcontrollers exhibited the strongest growth with an average revenue growth rate of 13.8%, followed by Analog at 12.4% and Other at 10.1%. We believe this strong growth in FY2022 and 2023 could be reflected by the MCU and analog market growth and Microchip’s product breadth in MCU and FPGA markets, as mentioned in our previous analysis. However, when examining the latest quarterly results, all segments were seen worsening.
Omdia, Khaveen Investments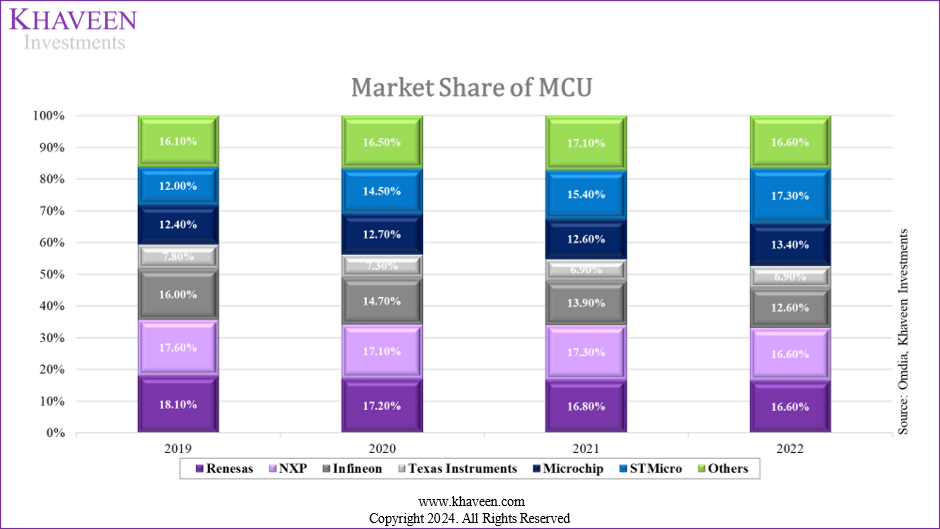
The chart above shows the MCU market share, the top three leading companies’ shares have been declining over the period. Renesas suffered a share loss of 1.5%, NXP by 1% and Infineon by 3.4%. On the contrary, Microchip’s market share has been rising from 12.4% to 13.4% in 2022. In our previous analysis, we highlighted that Microchip had the largest product breadth with the greatest number of MCU products ahead of its competitor by a large margin (6,357 higher than second-placed Infineon) which gives it a product breadth advantage. Moreover, over the past years, Microchip further expanded its product breadth as it released several new microcontroller product families such as PIC32CZ, AVR EB and PIC18-Q20.
IC Insights, WSTS, Company Data, Khaveen Investments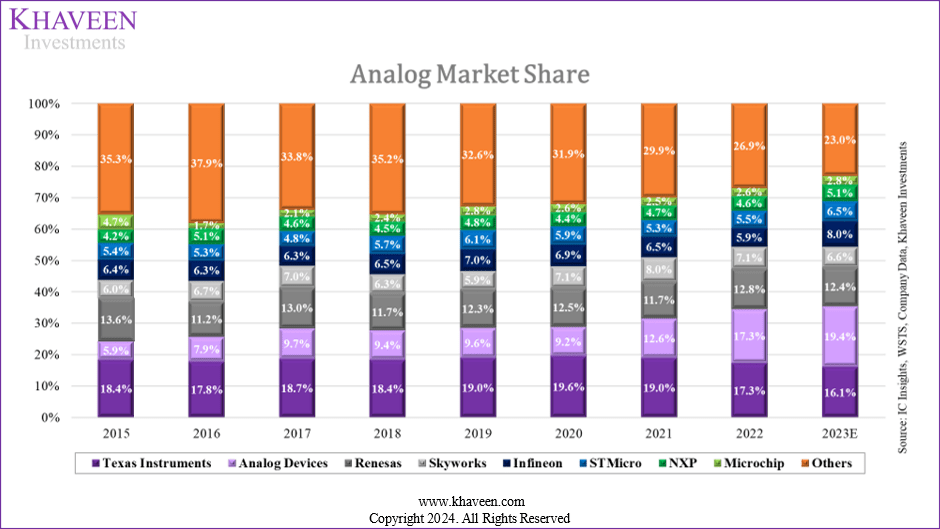
According to the chart above, Microchip has been gaining a larger share in the analog market, increasing from 1.7% to 2.6% in 2022 and we estimate its market share has increased to 2.8% in 2023. WSTS estimated a decline of 8.9% for the DAO market. The average growth of Microchip’s analog segment revenue in CY2023 was flattish at 1.3%, but still higher than the estimated market growth, thus Microchip outperformed the analog market. On the other hand, other leading analog companies such as Texas Instruments and Renesas have been losing their market shares over the years, whereas Analog Devices has been steadily increasing its share from 5.9% to 19.4% in 2023.
|
No. of Analog Products per Company |
Power Management |
Wireless and RF |
Thermal Management |
Total Products |
|
Microchip |
7565 (-237) |
339 (-1) |
497 (-46) |
8,401 |
|
NXP |
1658 (+118) |
830 (-127) |
39 (+11) |
2,527 |
|
STMicro |
2783 (-76) |
280 (-36) |
20 (+0) |
3,083 |
|
Analog Devices |
24944 (+8,178) |
2262 (+336) |
615 (+374) |
27,821 |
|
Texas Instruments |
21792 (-358) |
765 (+31) |
760 (-16) |
23,317 |
|
Total |
58,742 |
4,476 |
1,931 |
65,149 |
Source: Mouser Electronics, Khaveen Investments
We updated our breakdown of analog products across Microchip and its competitors to compare their product breadth. Based on the table, ADI leads with a total of 27,821 products with a significant increase in Power Management products. Texas Instruments comes second with 23,317 products, slightly lower than their previous count. STMicro and NXP showed minimal changes in their product breadth, while Microchip has experienced a decline in all its product categories. Overall, Microchip’s product breadth is only smaller than ADI and TI which are much larger companies than Microchip. Top of Form
|
Yearly Revenue Forecast (CY) ($ mln) |
2023 |
2024F |
2025F |
2026F |
2027F |
2028F |
|
Microcontrollers |
4,769 |
4,769 |
5,346 |
5,993 |
6,659 |
7,331 |
|
Growth (%) |
0.3% |
0.0% |
12.1% |
12.1% |
11.1% |
10.1% |
|
Analog |
2,249.6 |
2,250 |
2,447 |
2,662 |
2,870 |
3,065 |
|
Growth (%) |
-5.4% |
0.0% |
8.8% |
8.8% |
7.8% |
6.8% |
|
Other |
1,392.3 |
1,543 |
1,709 |
1,894 |
2,098 |
2,325 |
|
Growth (%) |
6.6% |
10.80% |
10.80% |
10.80% |
10.80% |
10.80% |
|
Total Revenue |
8,411 |
8,562 |
9,503 |
10,550 |
11,627 |
12,721 |
|
Total Growth |
-0.3% |
1.8% |
11.0% |
11.0% |
10.2% |
9.4% |
Source: Company Data, Khaveen Investments
All in all, we believe Microchip remains competitive in both the MCU and analog markets. We updated our revenue projections for the company based on its product segments above. The analog market is projected to grow at a CAGR of 7.3% whereas, for the MCU market, we previously projected it to grow by 11.18% in our previous analysis. We compared the historical performance in the MCU and analog market and derived a factor of 1.1x and 1.2x based on a 3-year average as Microchip has outperformed the markets. Thus, we expect the company to continue outperforming the MCU market growth by a factor of 1.1x due to its product breadth advantage as the company with the greatest number of products and its expansion of its product families over the year building on its product breadth advantage, whereas we also expect the company to continue outperforming the analog market by a factor of 1.2x due to its large analog product breadth which only trails behind much larger companies such as TI and ADI. We forecasted its revenue growth in 2025 and beyond based on the market CAGR multiplied by the performance growth factor, tapering down in 2027 by 1% each year. However, in 2023, we conservatively assumed a 0% growth assumption as we see the DAO market remaining weak until a recovery from Q3 or Q4 2024.
Risk: Days Inventory Surge
|
Company Inventory Days |
2013 |
2014 |
2015 |
2016 |
2017 |
2018 |
2019 |
2020 |
2021 |
2022 |
TTM |
|
Inventory Turnover |
4.67x |
2.27x |
2.18x |
2.75x |
2.11x |
2.60x |
1.17x |
1.34x |
1.62x |
1.60x |
1.45x |
|
Days Inventory Outstanding (days) |
78 |
161 |
167 |
133 |
173 |
141 |
312 |
272 |
226 |
228 |
252 |
Source: Company Data, Khaveen Investments
We reviewed Microchip’s inventory and observed that the inventory turnover ratio rose in 2021 but fell again to 1.45x in the latest twelve-month period (TTM). Meanwhile, the number of days the inventory outstanding decreased to 226 days in 2021 but increased again to 252 days in TTM. However, we believe this reflects the DAO market weakness as explained in the previous points and we expect its inventory situation to improve as we see the DAO market recovering from Q3 or Q4 2024 (180 to 270 days), which could lead to improvement in its days’ inventory.
Verdict
Khaveen Investments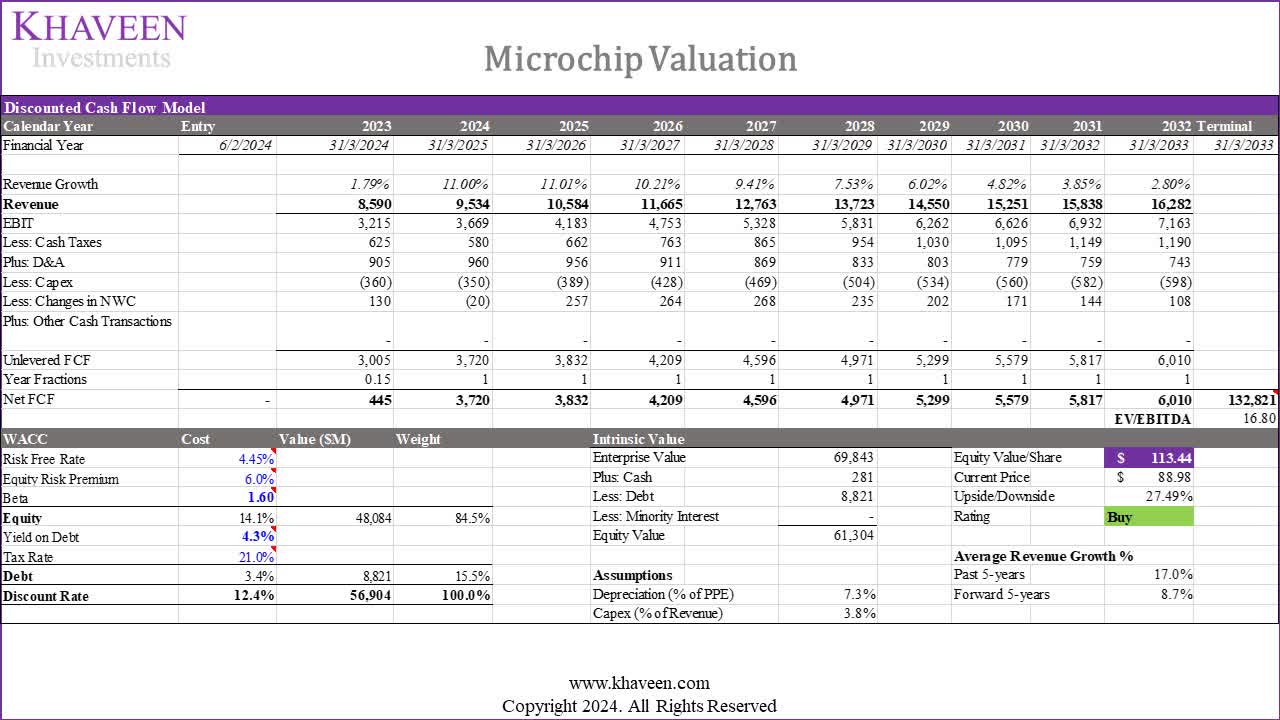
Based on a discount rate of 12.3% (the company’s WACC), we derived an upside of 27.49% based on its past 5-year EV/EBITDA of 16.8x (lower than the US Chipmaker average of 22x).
All in all, the company has faced a significant revenue slowdown, particularly in the Microcontroller and Analog segments. We attribute this primarily to a broader market weakness in the DAO segment, driven by China’s economic struggles affecting the PC and smartphone markets. Our analysis suggests a potential rebound in the DAO segment by Q2 2024, with full recovery by Q3-Q4 2024. Despite these challenges, we believe Microchip maintains competitiveness in both the MCU and analog markets. Our updated revenue projections consider the analog market’s 7.3% CAGR and the MCU market’s 11.18% growth, factoring in Microchip’s historical outperformance. We expect continued outperformance based on its product breadth, forecasting revenue growth for 2025 and beyond. We conservatively assume 0% growth in the DAO market for 2023, anticipating a recovery from Q3 or Q4 2024. Based on our updated DCF, we rate the company as a Buy with a slightly higher price target of $113.44 (vs $96.71 previously) due to an increase in the EV/EBITDA multiple for the terminal value based on the company’s 5-year average (16.8x vs 13.13x previously).